|
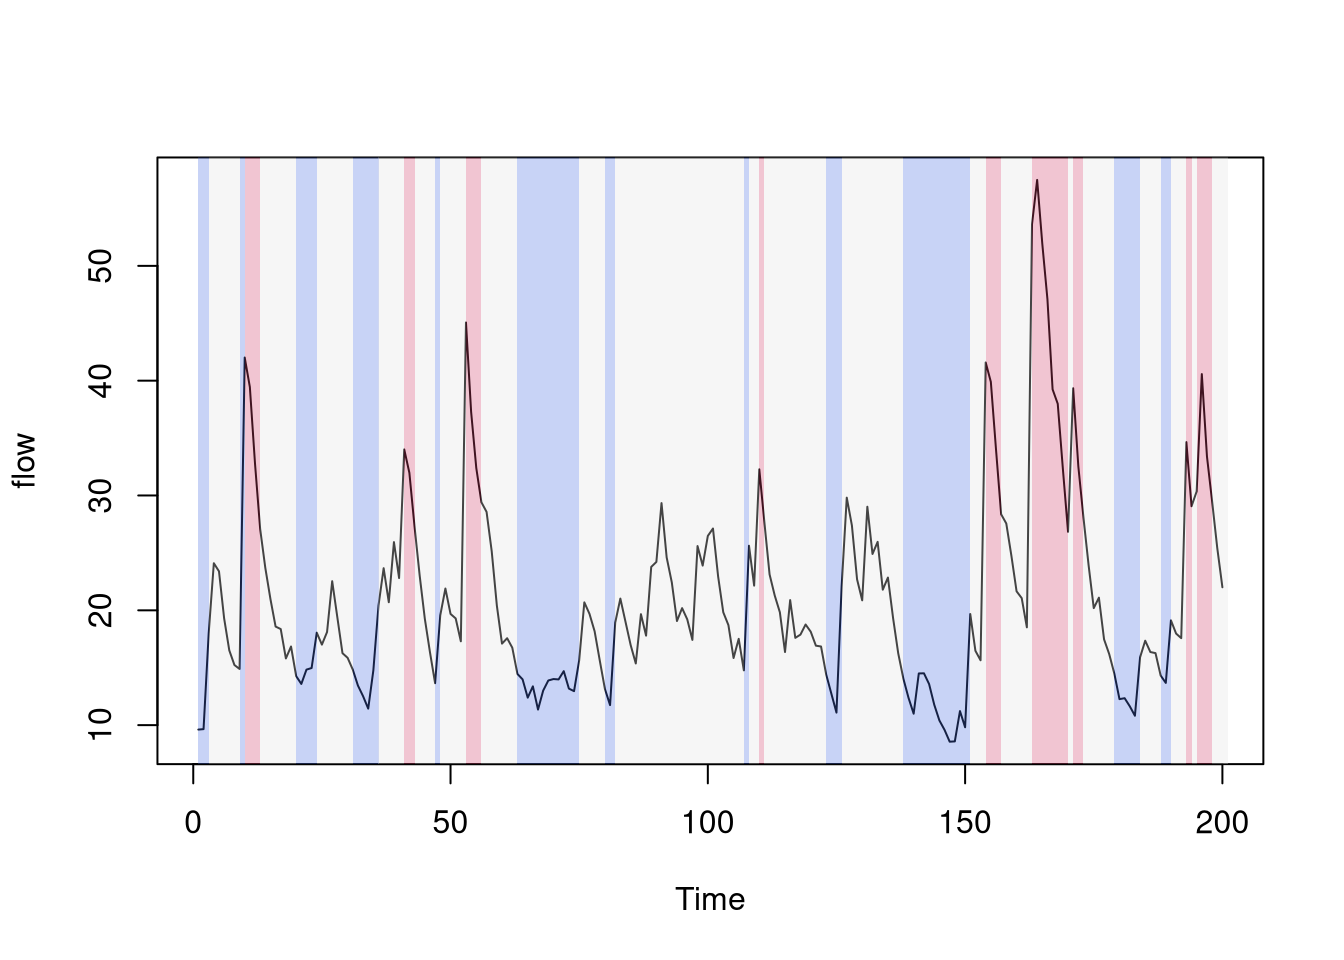
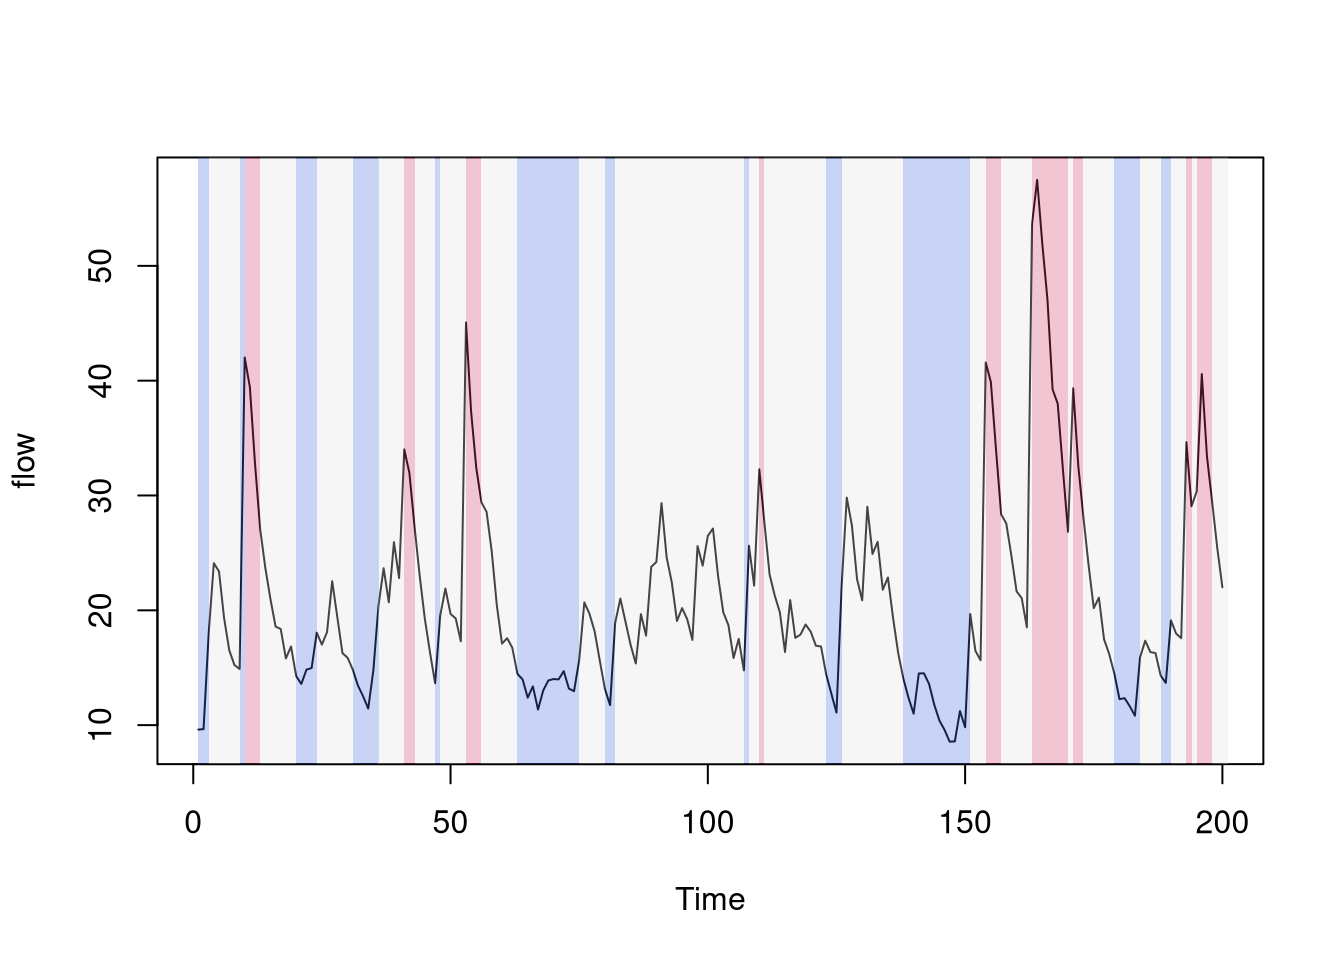
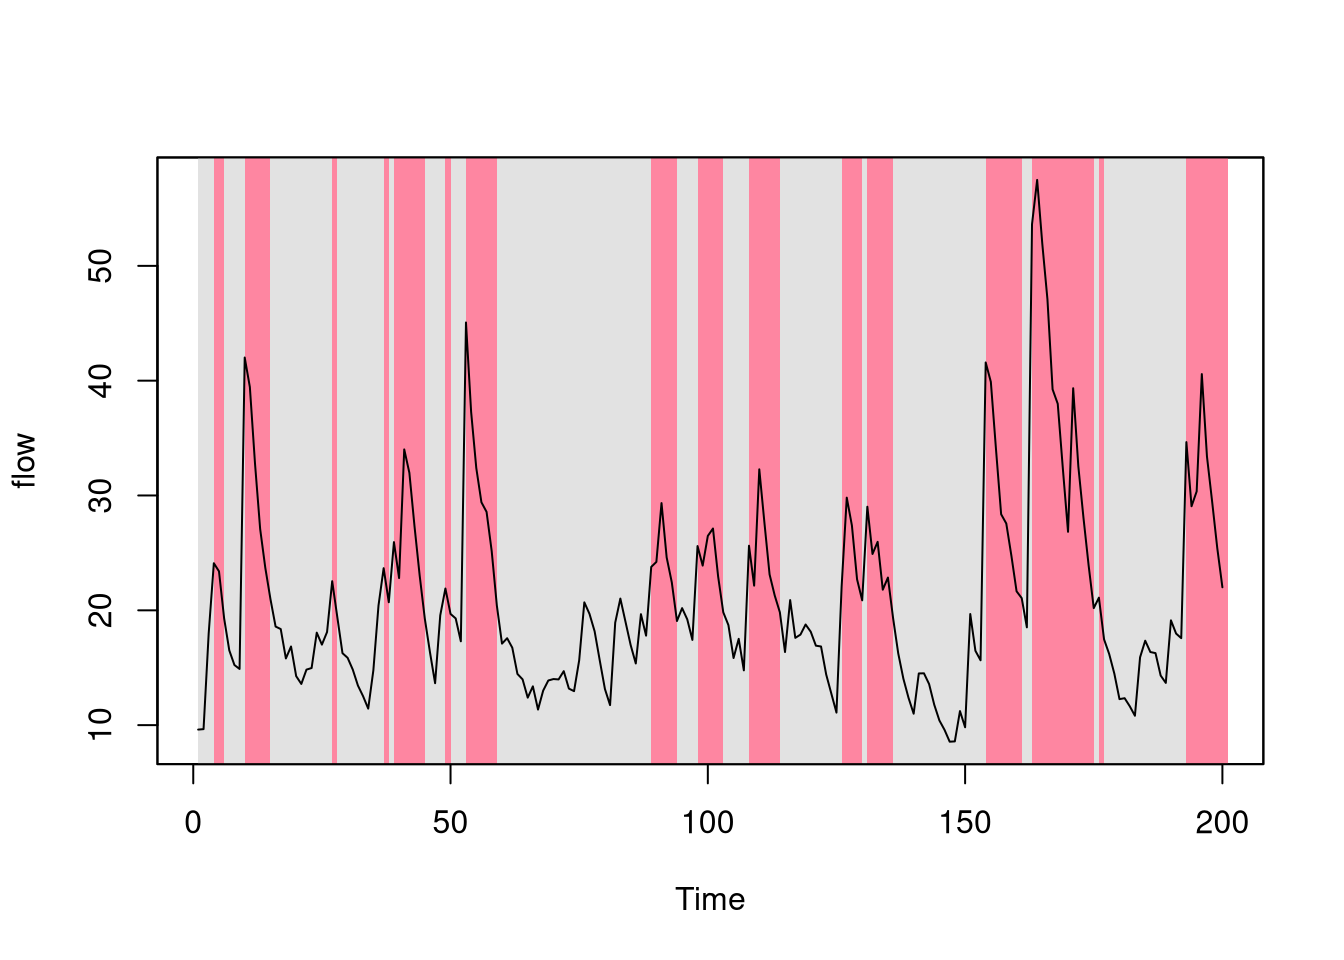
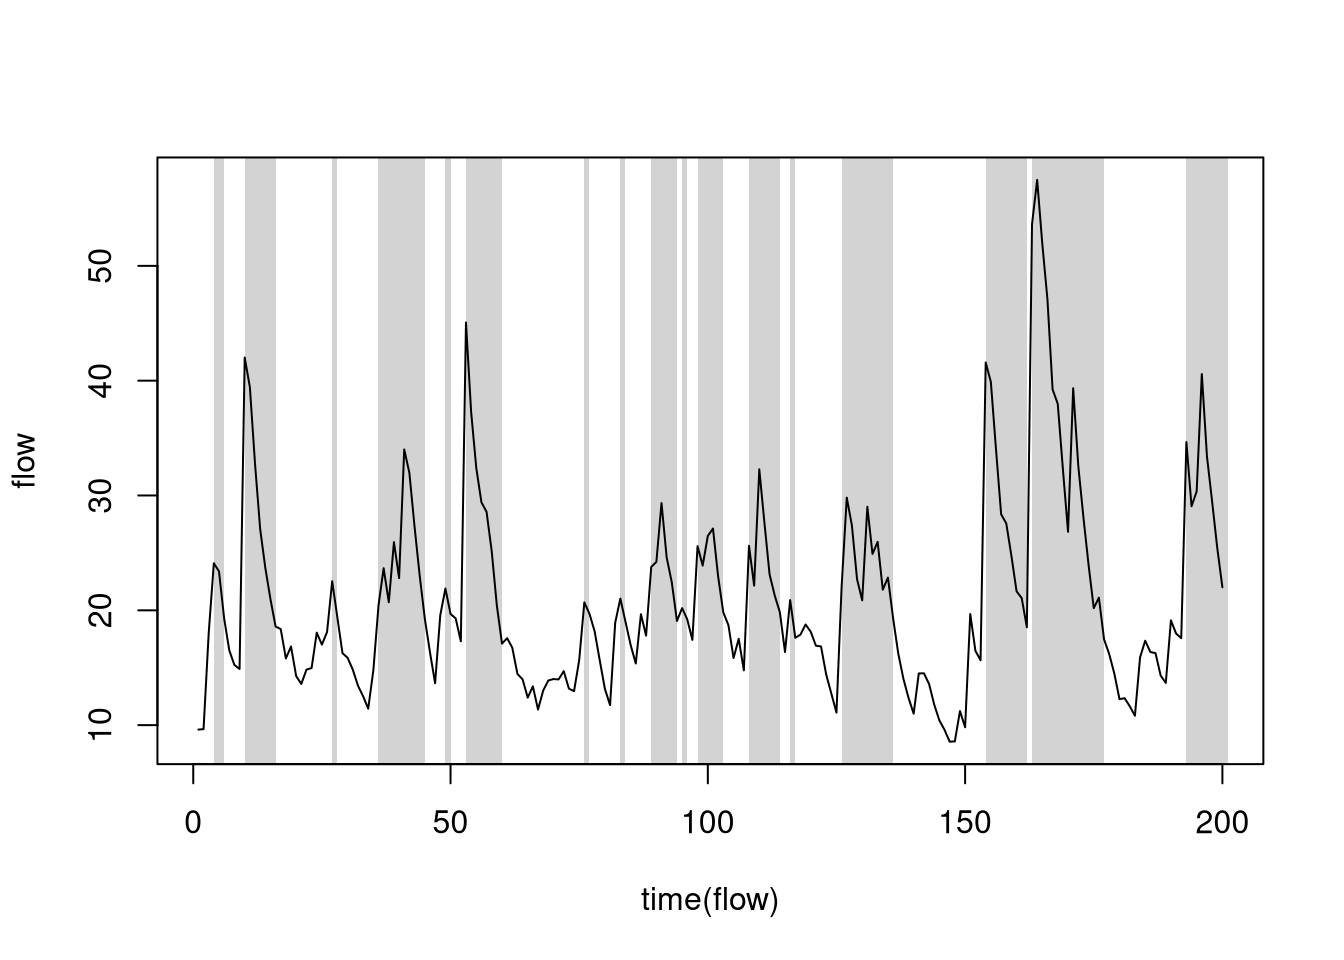
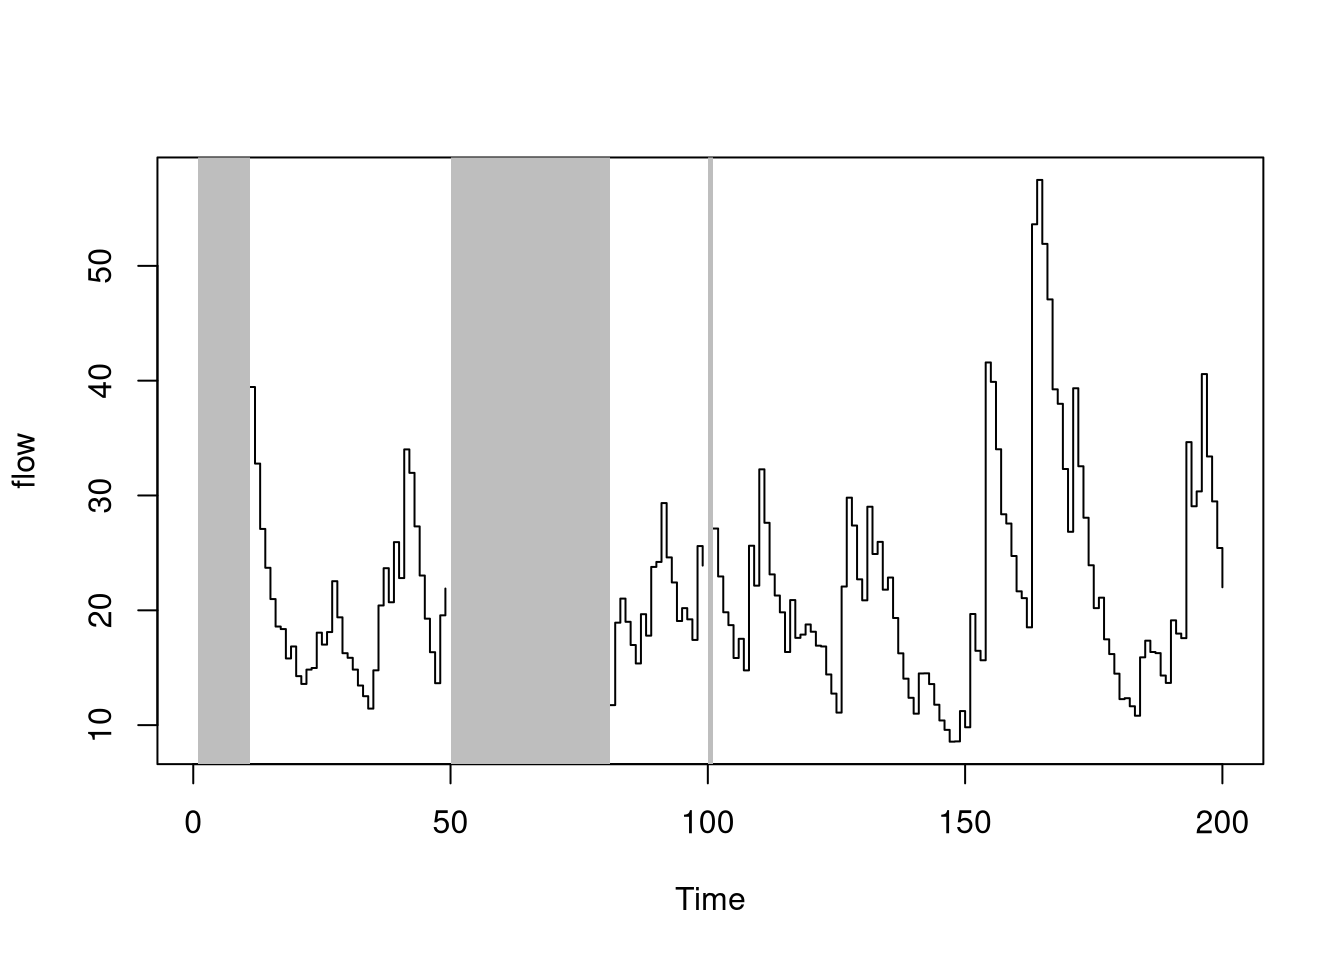
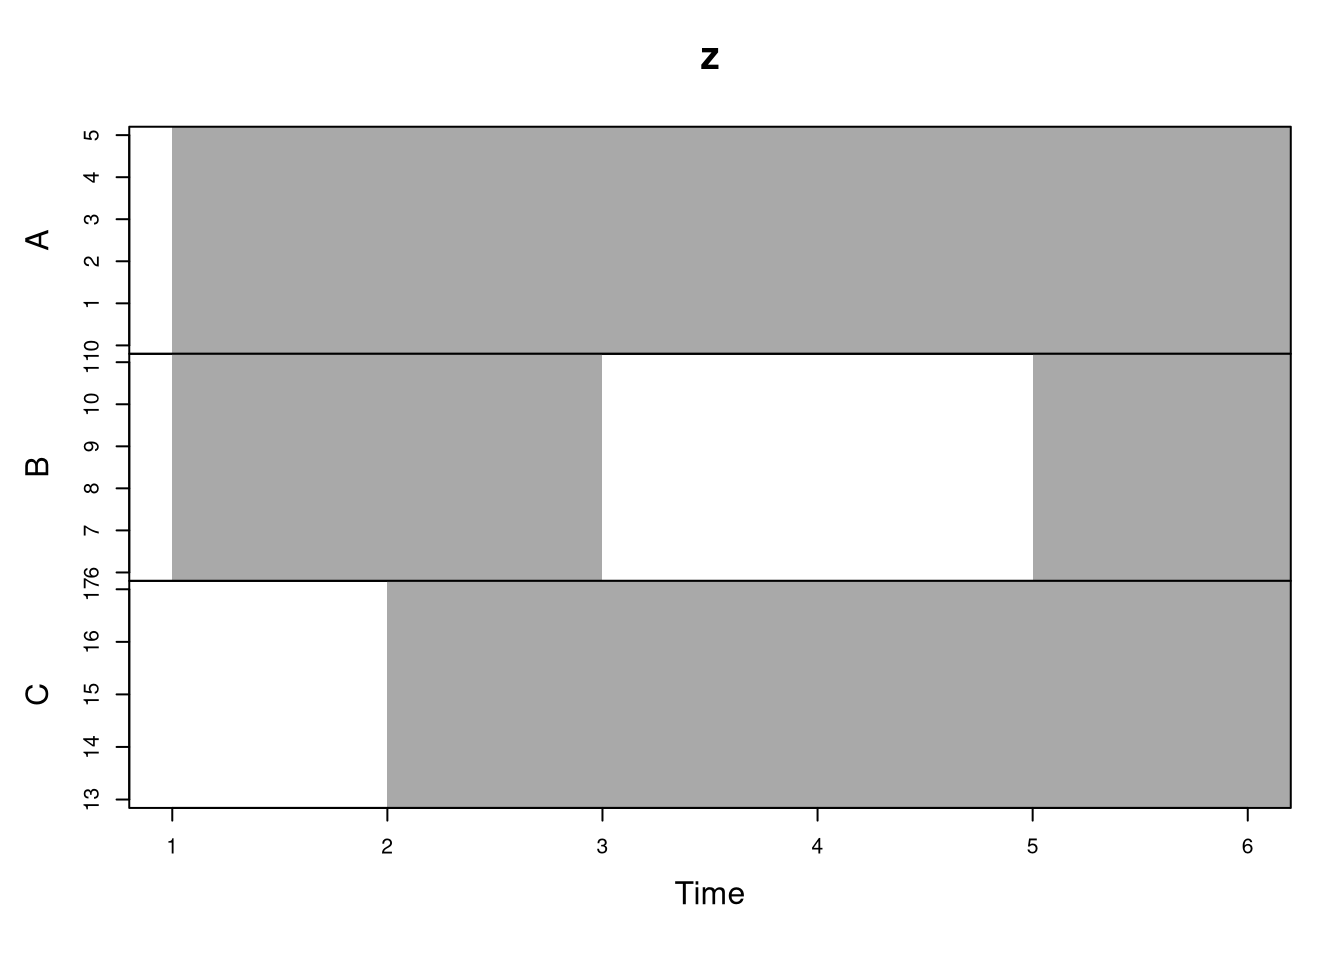
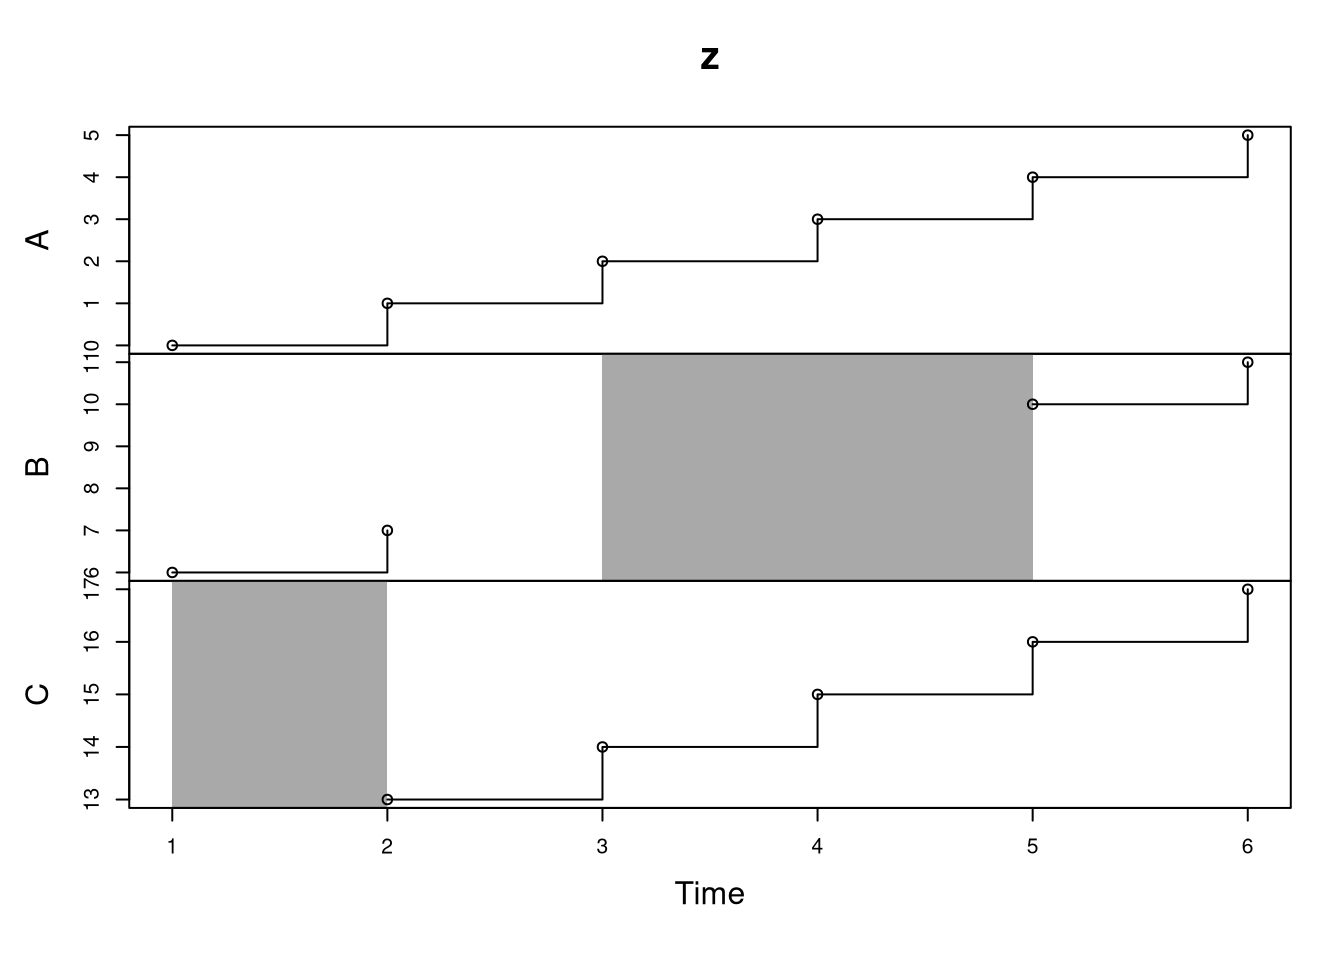
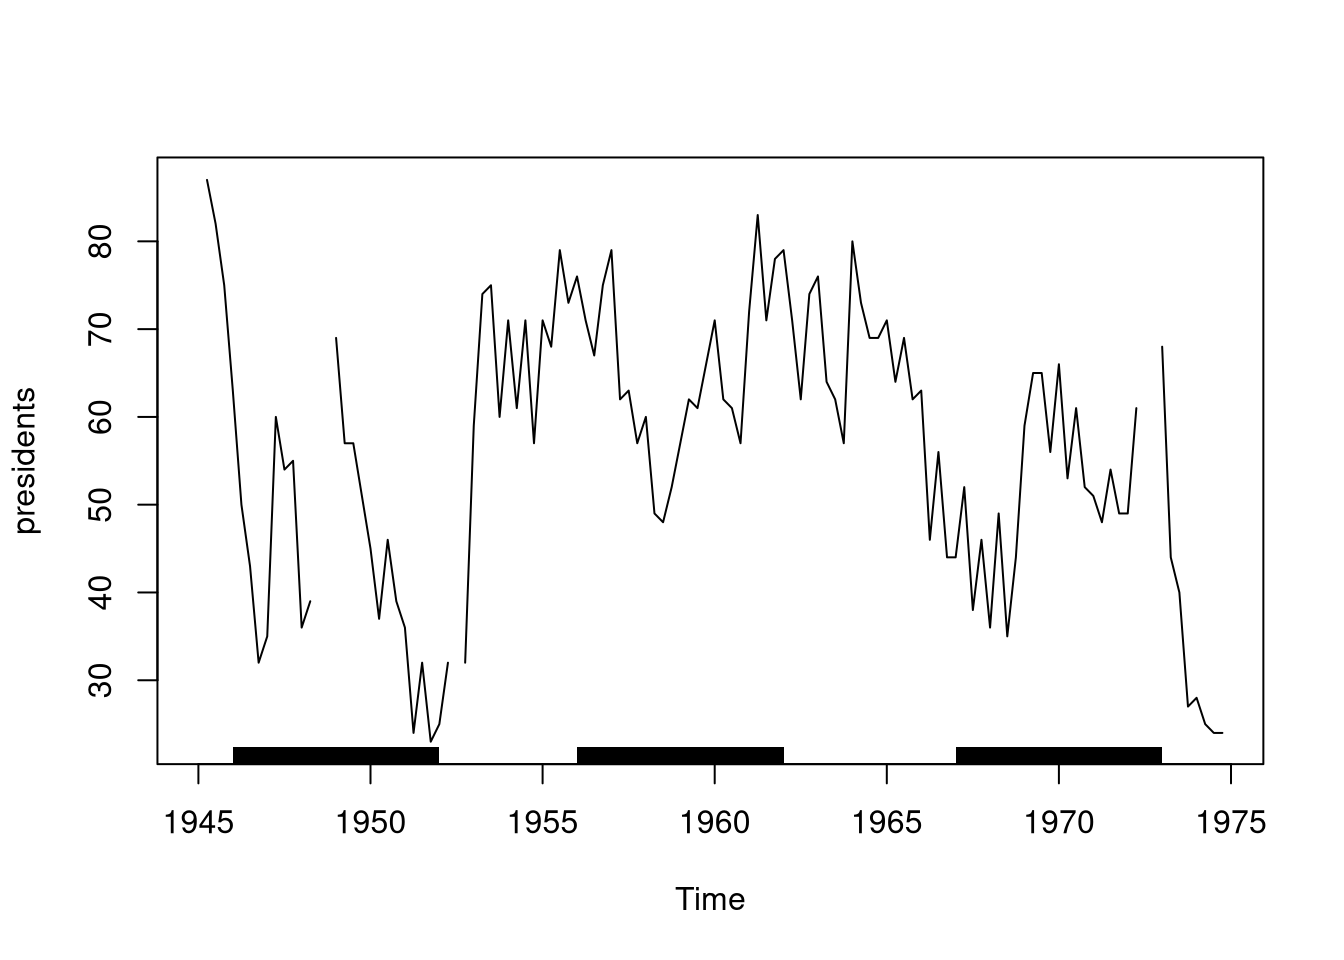
In the default method, x gives the ordinates along the x axis and must be in increasing order. y gives the color values to plot as contiguous blocks. If y is numeric, data coverage is plotted, by converting it into a logical (!is.na(y)). Finally, if y is a function, it is applied to x (time(x) in the time series methods).
If y has character (or factor) values, these are interpreted as colors – and should therefore be color names or hex codes. Missing values in y are not plotted. The default color is taken from palette()[1]. If col is given, this over-rides the block colors given as y.
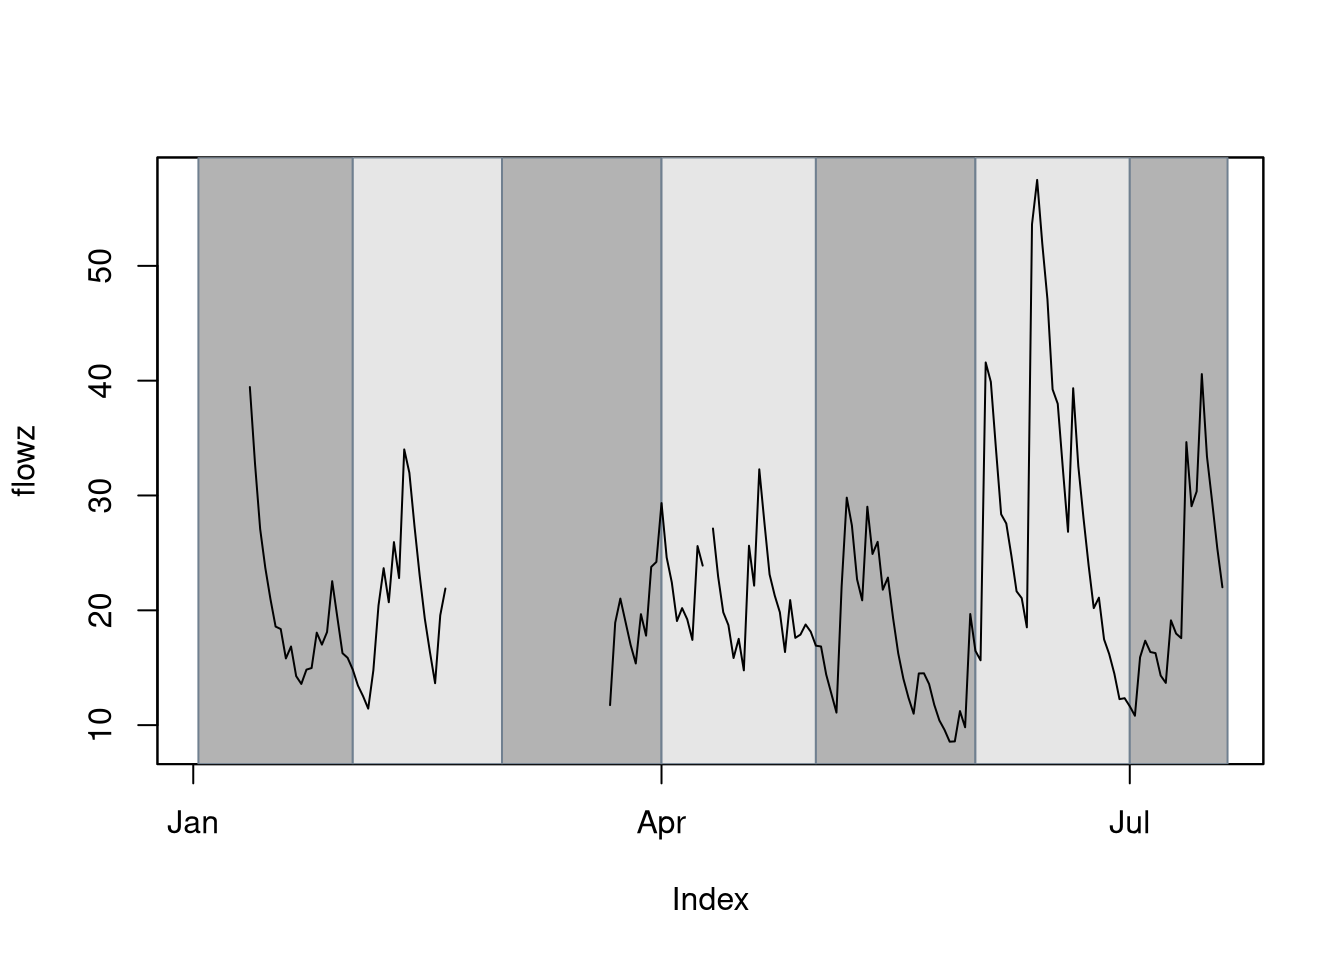
The ts and zoo methods plot the coredata(y) values against the time index index(x).
|