library("zoo")


library("ggplot2")
library("scales")
suppressWarnings(RNGversion("3.5.0"))
set.seed(1)

## example data
x.Date <- as.Date(paste(2003, 02, c(1, 3, 7, 9, 14), sep = "-"))
x <- zoo(rnorm(5), x.Date)
xlow <- x - runif(5)
xhigh <- x + runif(5)
z <- cbind(x, xlow, xhigh)

## univariate plotting
autoplot(x)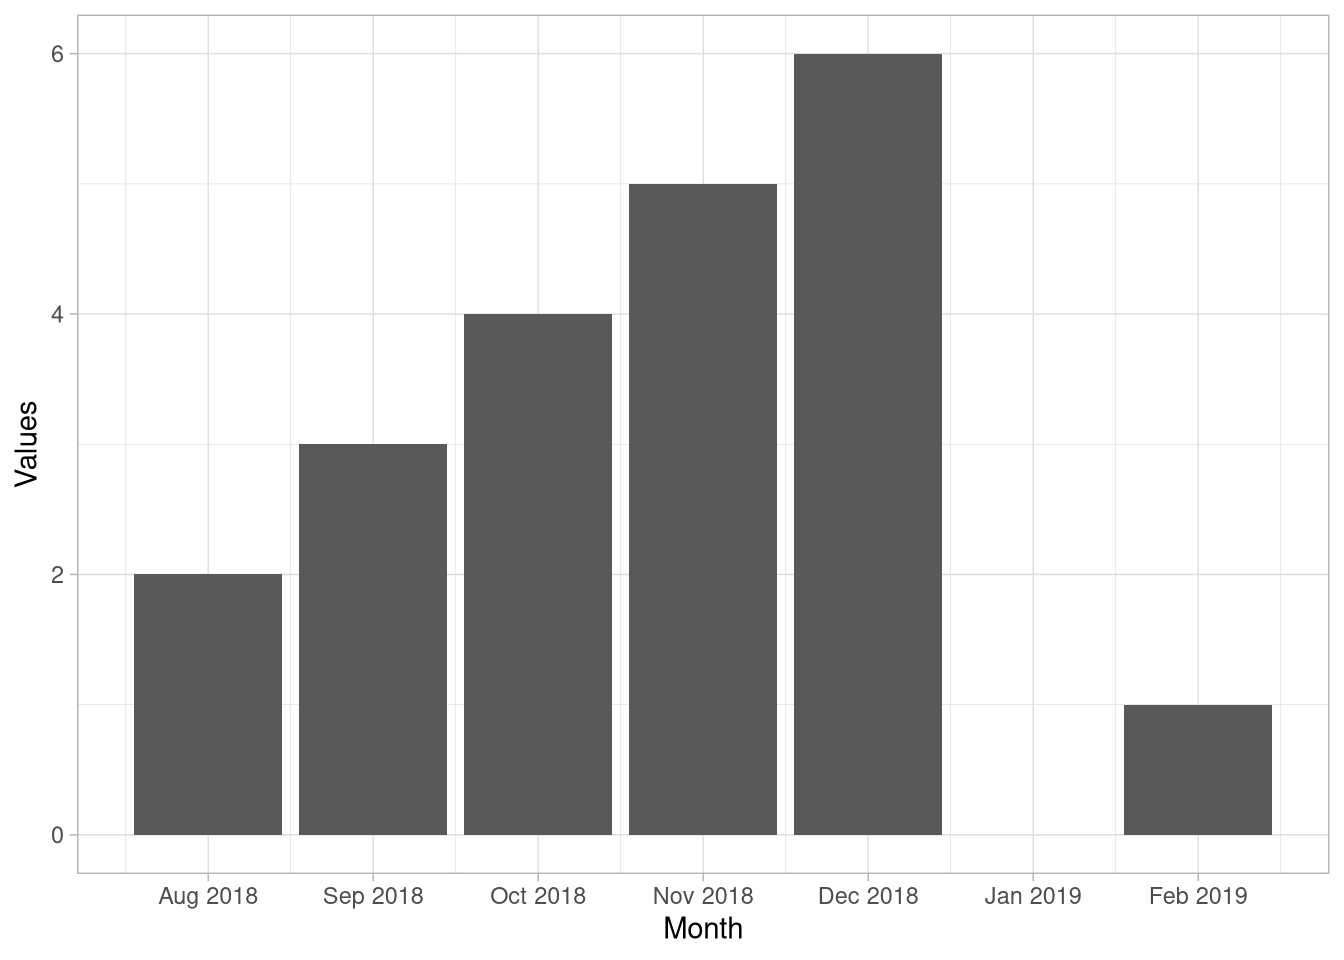


## add ribbon for high/low band
ggplot(aes(x = Index, y = x, ymin = xlow, ymax = xhigh), data = fortify(x)) +
  geom_ribbon(fill = "darkgray") + geom_line()
## multivariate plotting in multiple or single panels
autoplot(z)                      ## multiple without color/linetype
autoplot(z, facets = Series ~ .) ## multiple with series-dependent color/linetype
autoplot(z, facets = NULL) ## single with series-dependent color/linetype

ggz + facet_grid(Series ~ .)
## variations
autoplot(z, geom = "point")
autoplot(z, facets = NULL) + geom_point()
autoplot(z, facets = NULL) + scale_colour_grey() + theme_bw()


autoplot(z) +
    aes(colour = NULL, linetype = NULL) +
    facet_grid(Series ~ ., scales = "free_y")
autoplot(z) + aes(colour = NULL, linetype = NULL) + facet_free() # same
z.yq <- zooreg(rnorm(50), as.yearqtr("2000-1"), freq = 4)
autoplot(z.yq)

## with different line types
autoplot(zoo(data), facet = NULL) + geom_point() + aes(linetype = Series)
  Index  A  B  C
1     1  6 16 25
2     2  1  4  7
3     3 NA  1  2
4 4 NA NA 1fortify(z, melt = TRUE) Index Series Value
1 1 A 6
2 2 A 1
3 3 A NA
4 4 A NA
5 1 B 16
6 2 B 4
7 3 B 1
8 4 B NA
9 1 C 25
10 2 C 7
11 3 C 2
12 4 C 1 Time Series Data
1 1 A 6
2 2 A 1
3 3 A NA
4 4 A NA
5 1 B 16
6 2 B 4
7 3 B 1
8 4 B NA
9 1 C 25
10 2 C 7
11 3 C 2
12 4 C 1 Time Series Value
1 1 A 6
2 2 A 1
3 3 A NA
4 4 A NA
5 1 B 16
6 2 B 4
7 3 B 1
8 4 B NA
9 1 C 25
10 2 C 7
11 3 C 2
12 4 C 1 Index a.A a.B b.A c.B
1 1 1 2 3 4
2 2 2 3 4 5 Index Lower Upper Value
1 1 a A 1
2 2 a A 2
3 1 a B 2
4 2 a B 3
5 1 b A 3
6 2 b A 4
7 1 c B 4
8 2 c B 5## scale_x_yearmon with custom discrete breaks
df <- data.frame(dates = as.yearmon("2018-08") + 0:6/12, values = c(2:6, 0, 1))
ggdf <- ggplot(df, aes(x = dates, y = values)) +
geom_bar(position = "dodge", stat = "identity") + theme_light() +
xlab("Month") + ylab("Values")
ggdf ## with default scale_x_yearmon
ggdf + scale_x_yearmon(breaks = df$dates) ## with custom discrete breaks