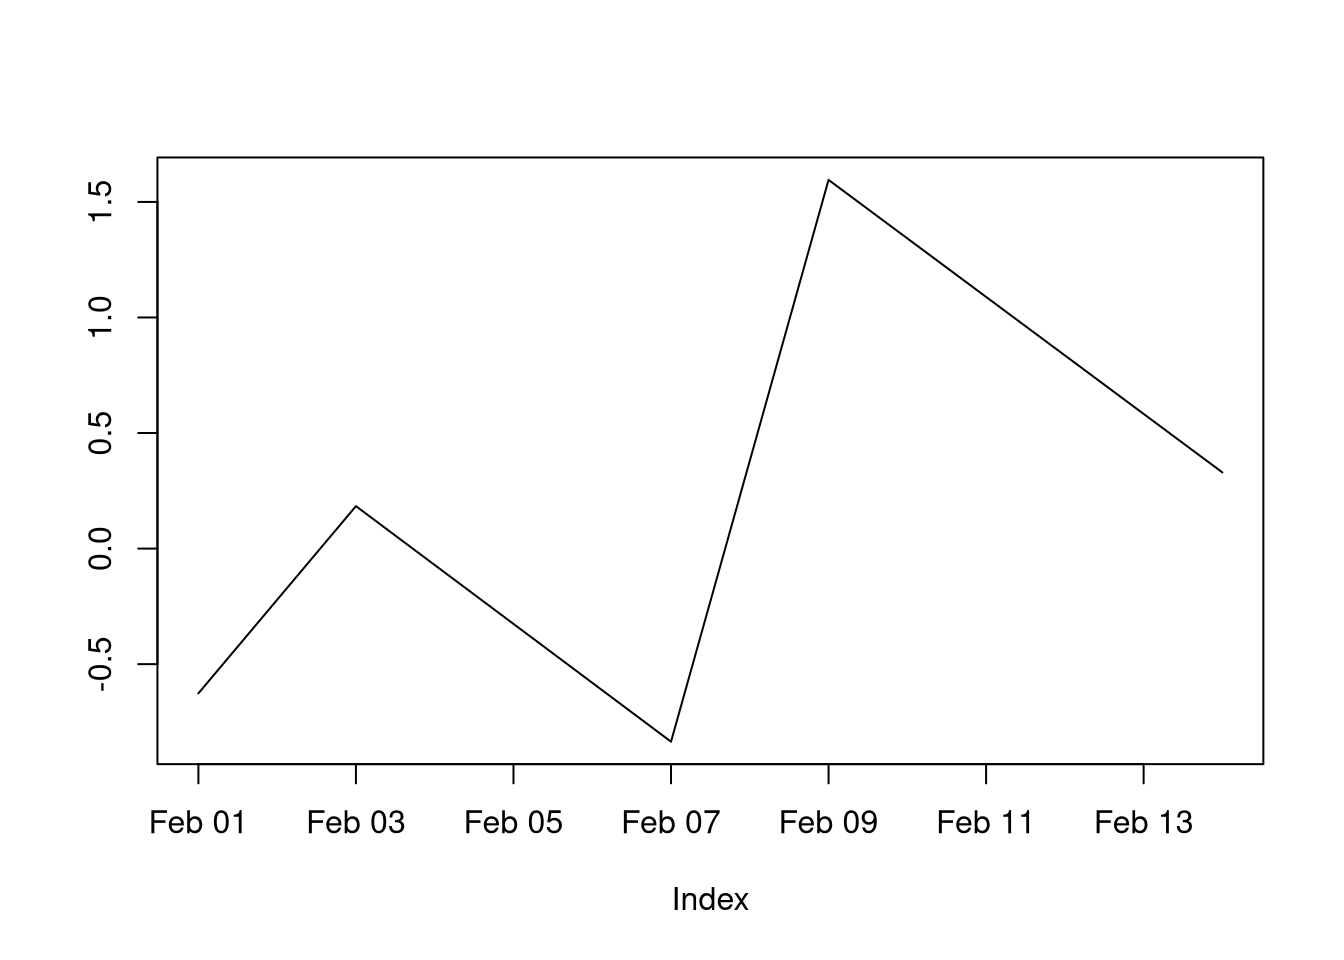
## multivariate plotting in multiple or single panels
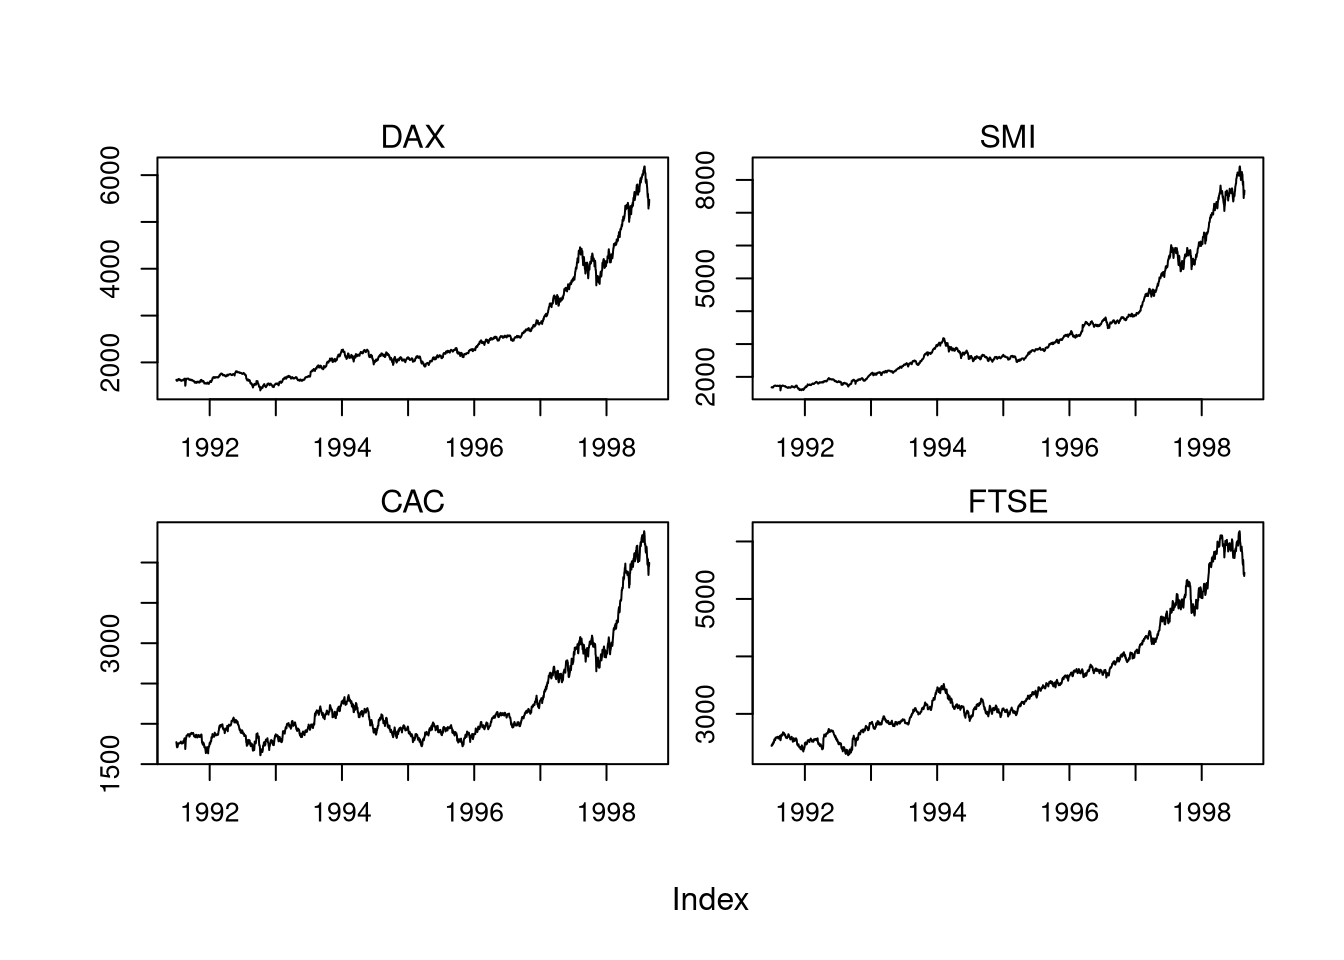
tinyplot(z)                    ## multiple without color/linetype with free scales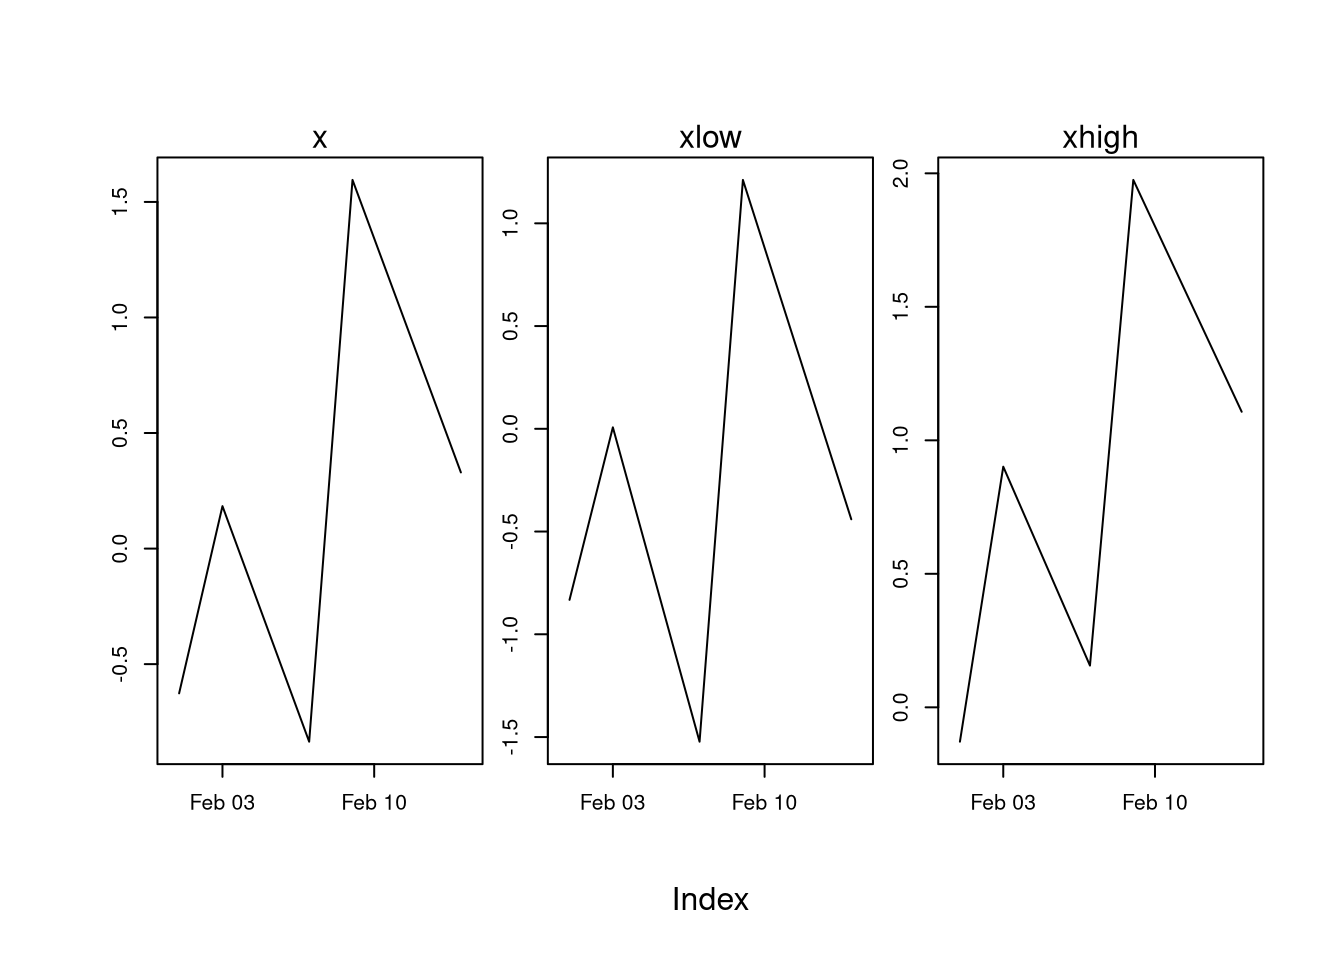
tinyplot(z, facet.args = NULL) ## multiple without color/linetype with same scale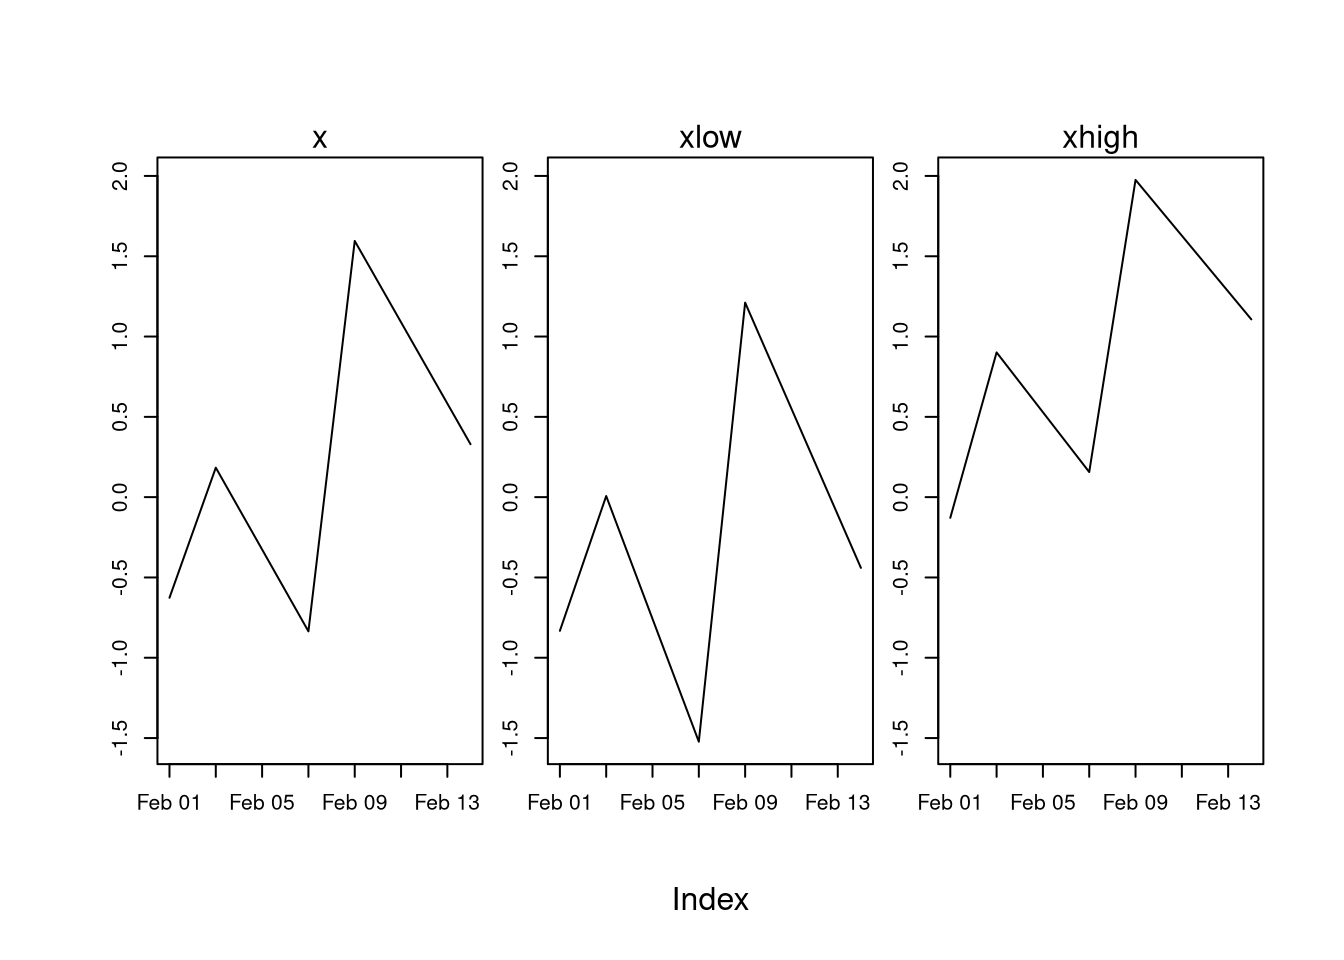
tinyplot(z, facet = ~ Series) ## multiple with series-dependent color/linetype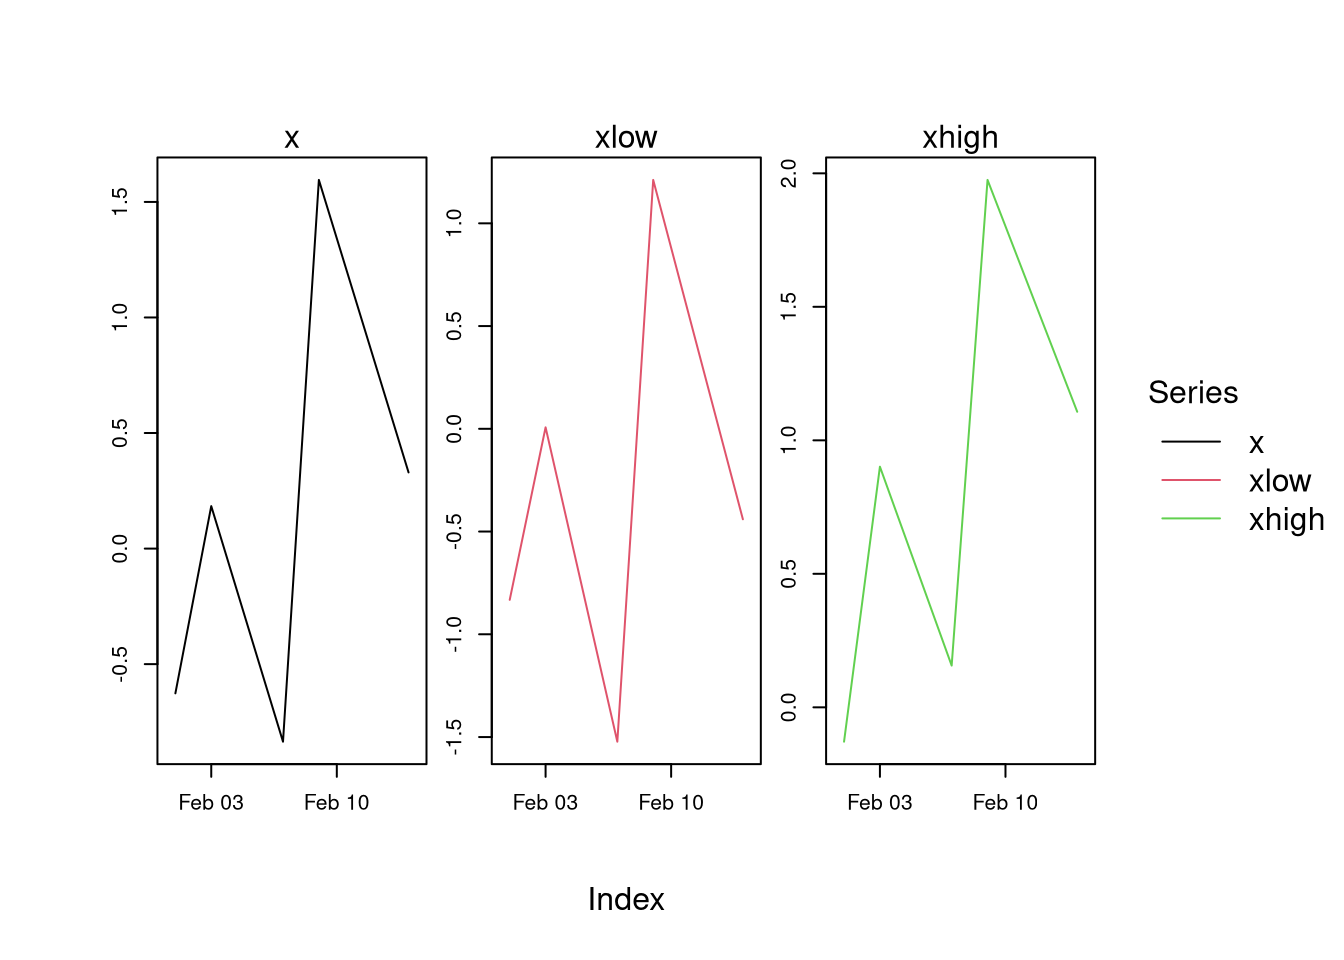
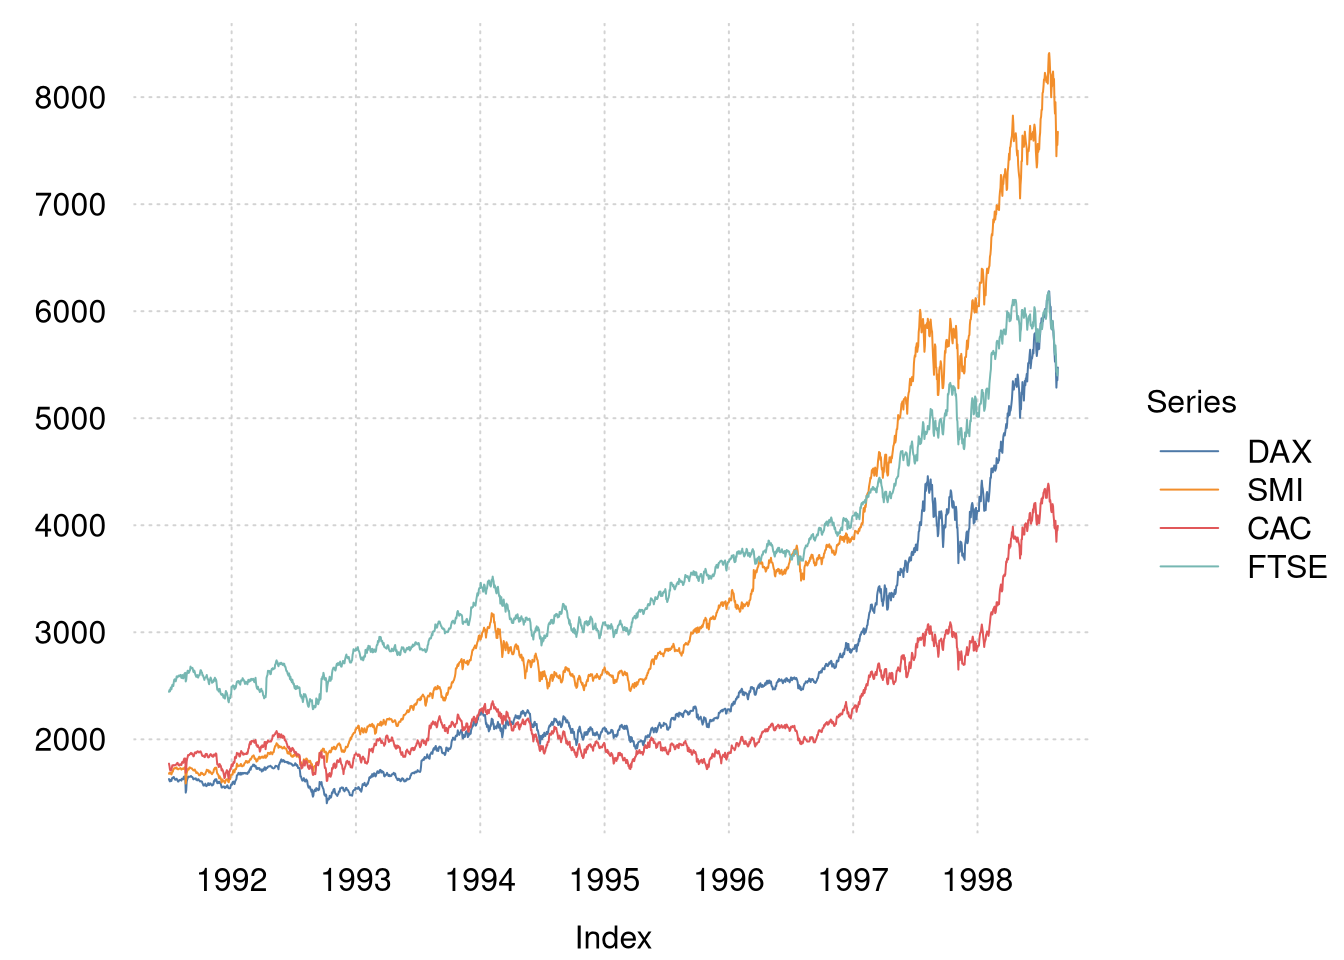
tinyplot(z, facet = NULL) ## single with series-dependent color/linetype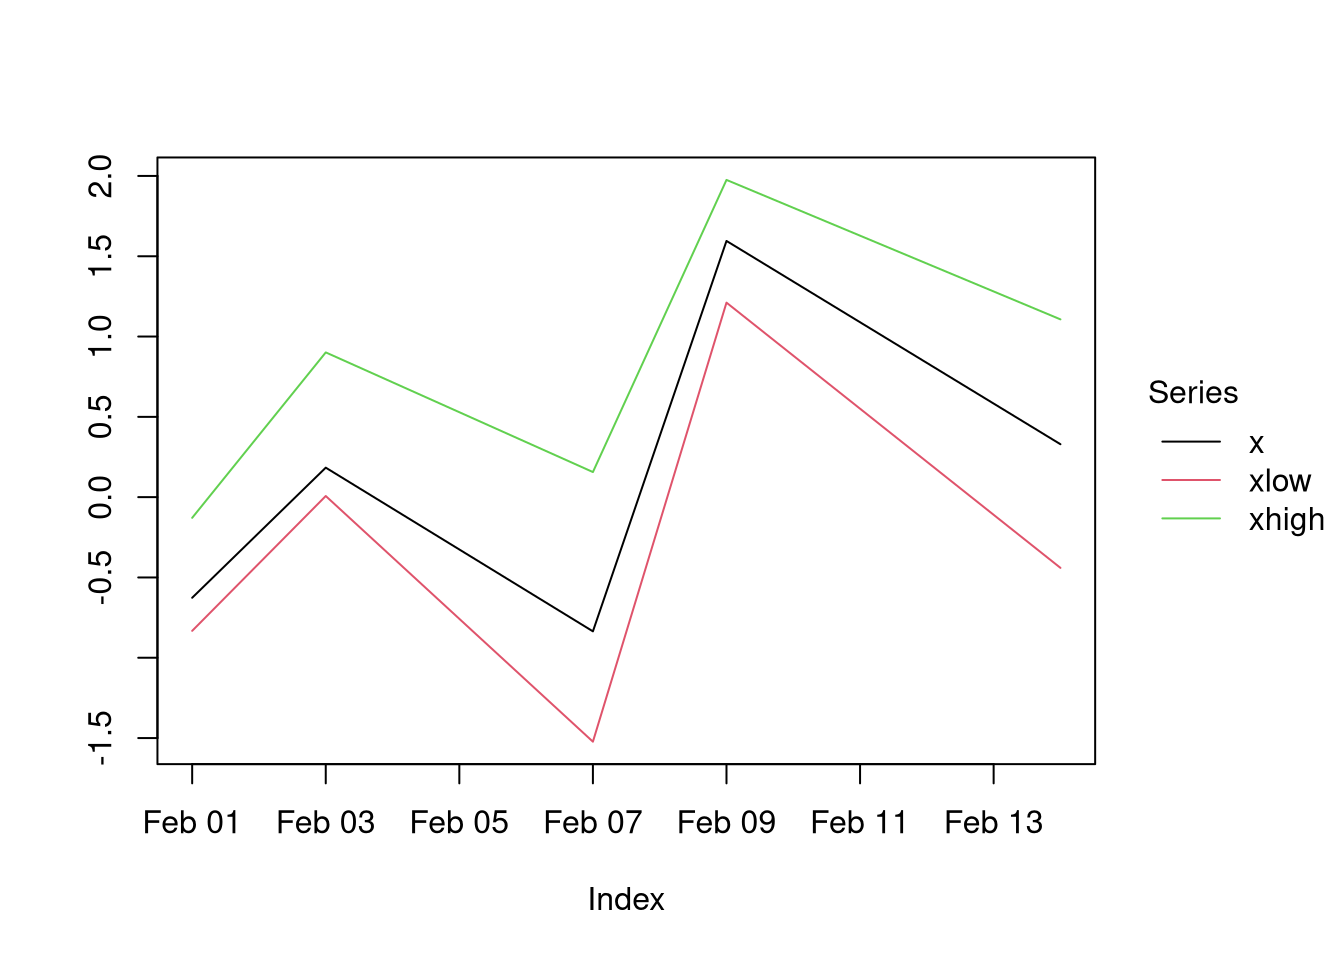
## by hand with color/linetype and with/without facets
d <- fortify.zoo(z, melt = TRUE)
tinyplot(Value ~ Index | Series, data = d, type = "l")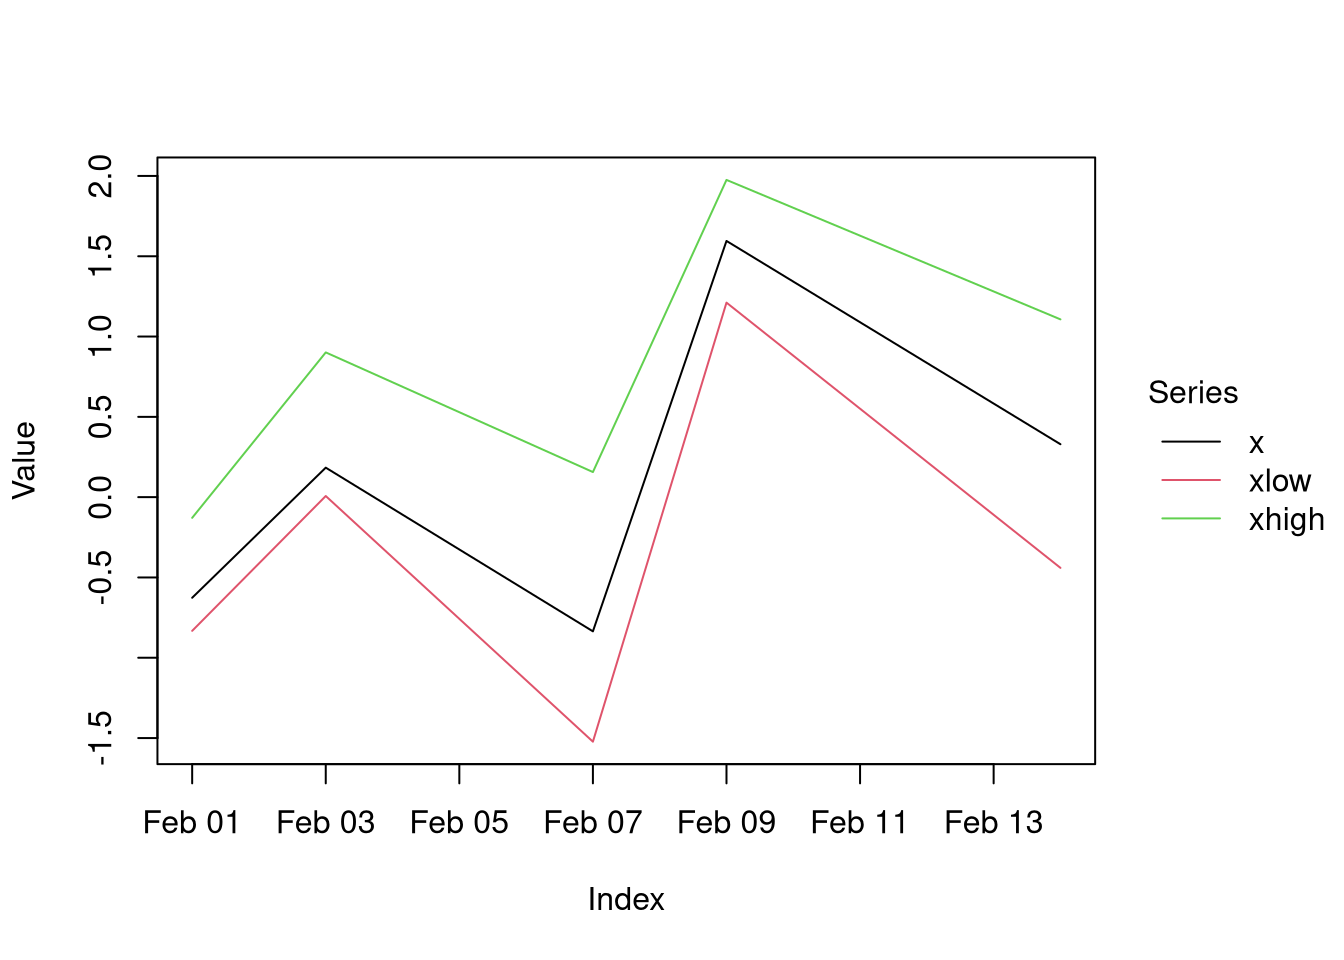
tinyplot(Value ~ Index | Series, facet = "by", data = d, type = "l")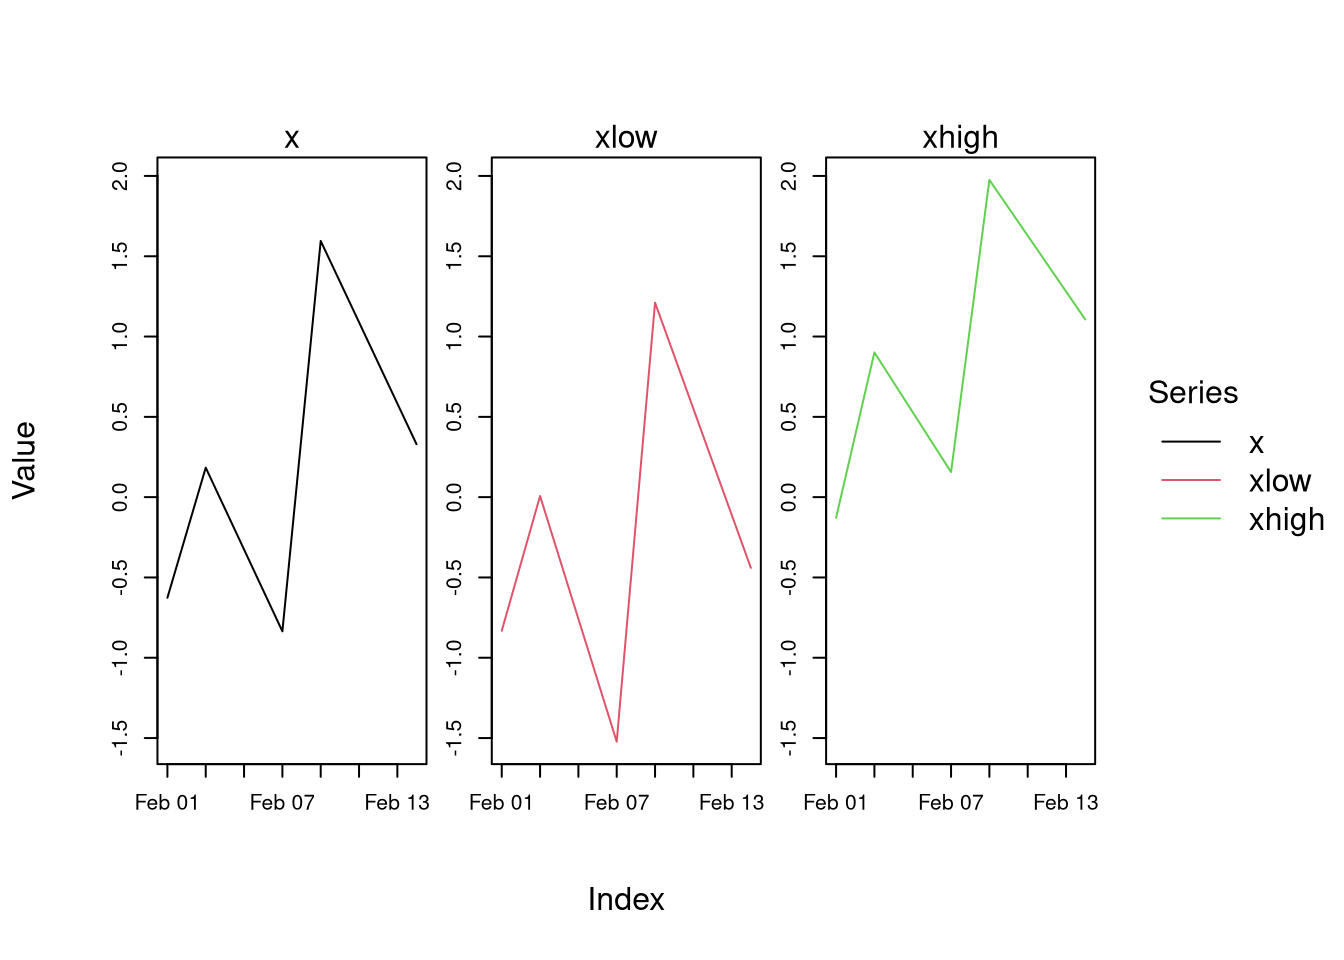
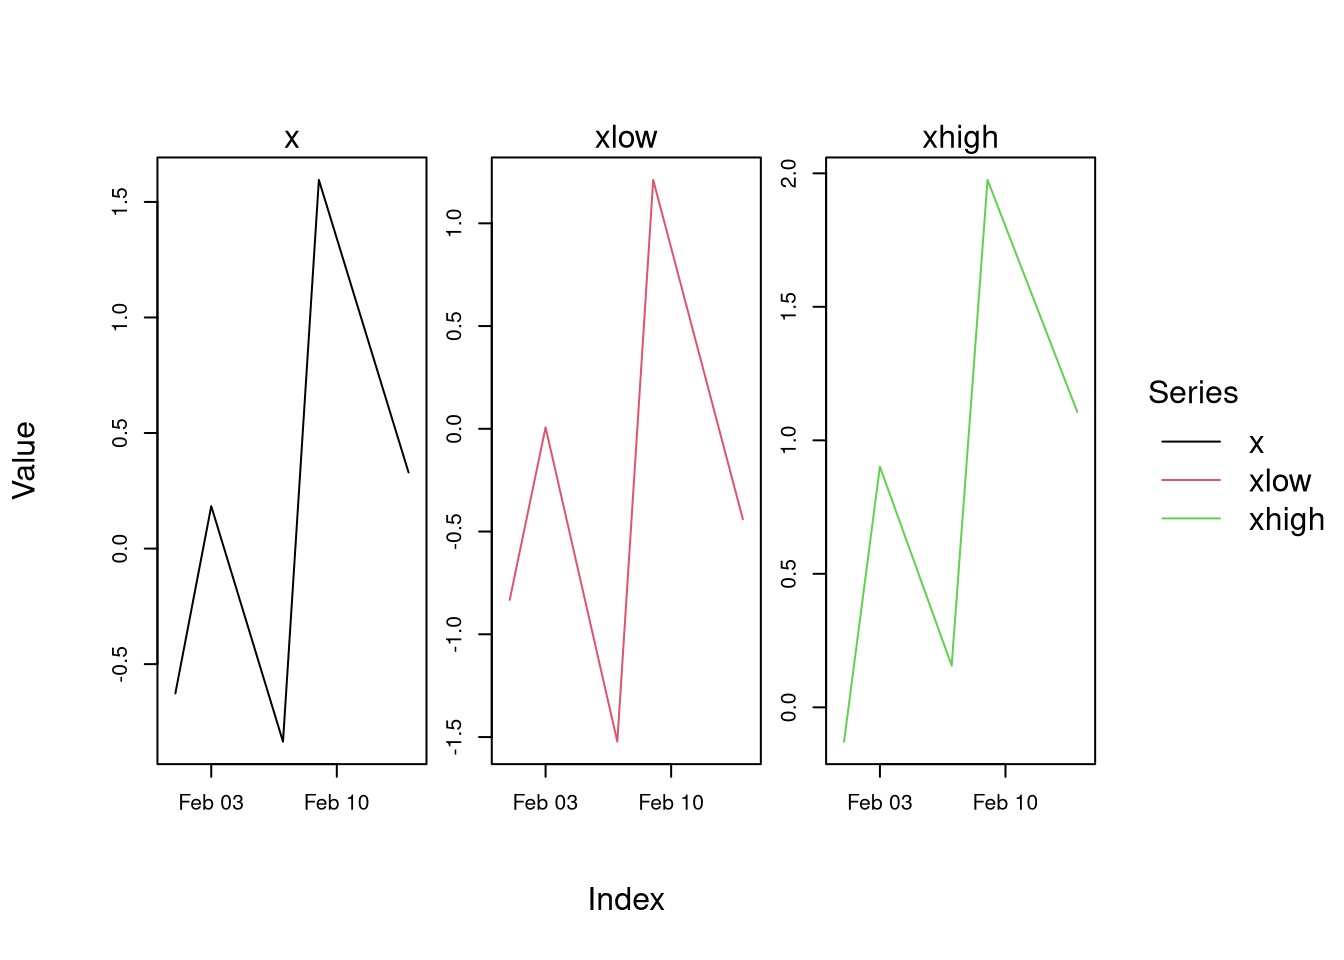
tinyplot(eusm, facet = ~ Series)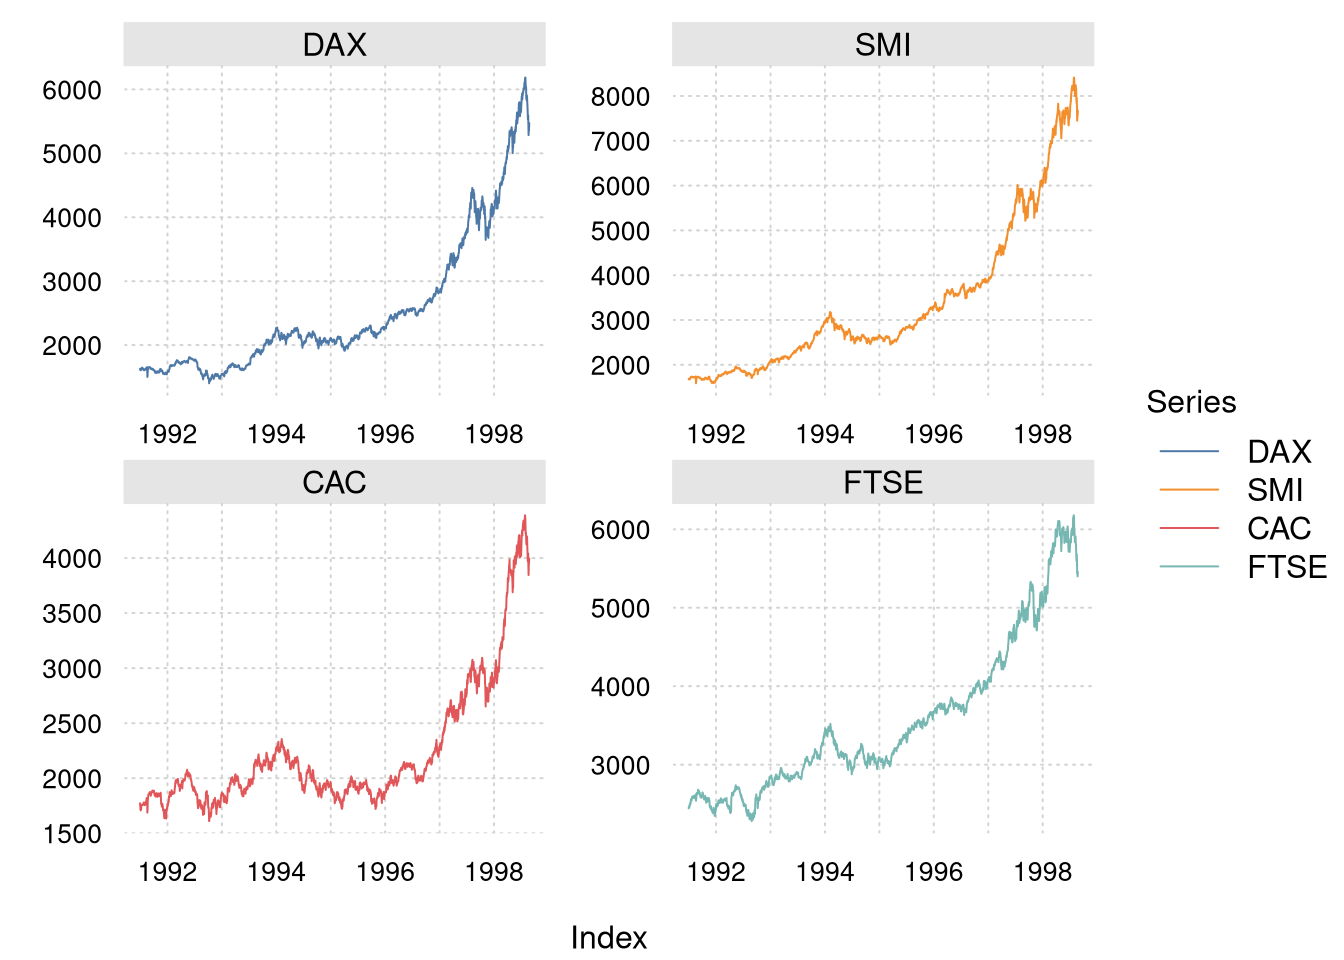
tinyplot(eusm, facet = ~ Series, facet.args = NULL)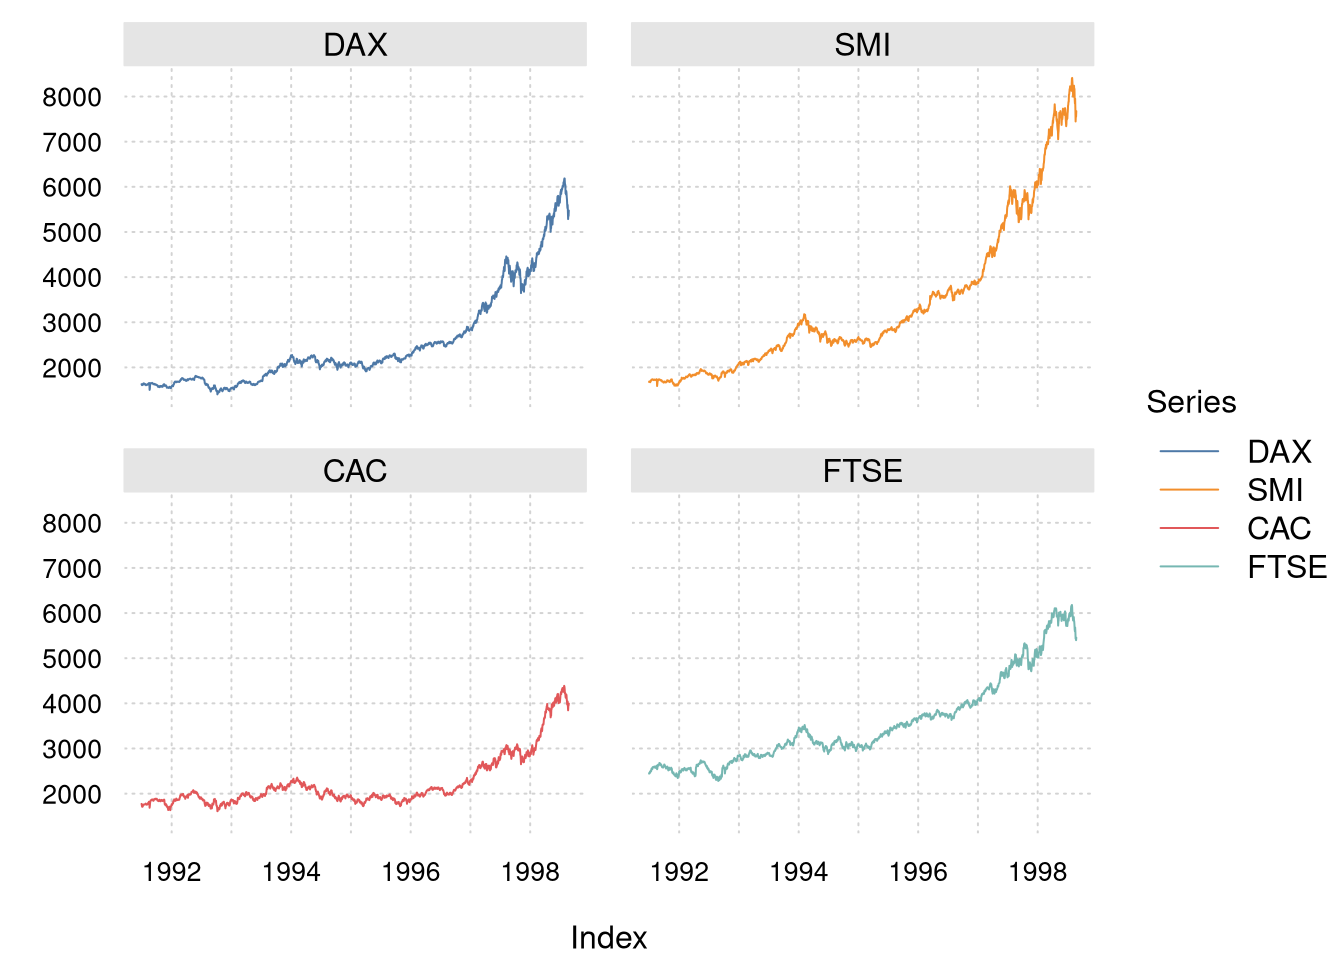
tinytheme() ## reset