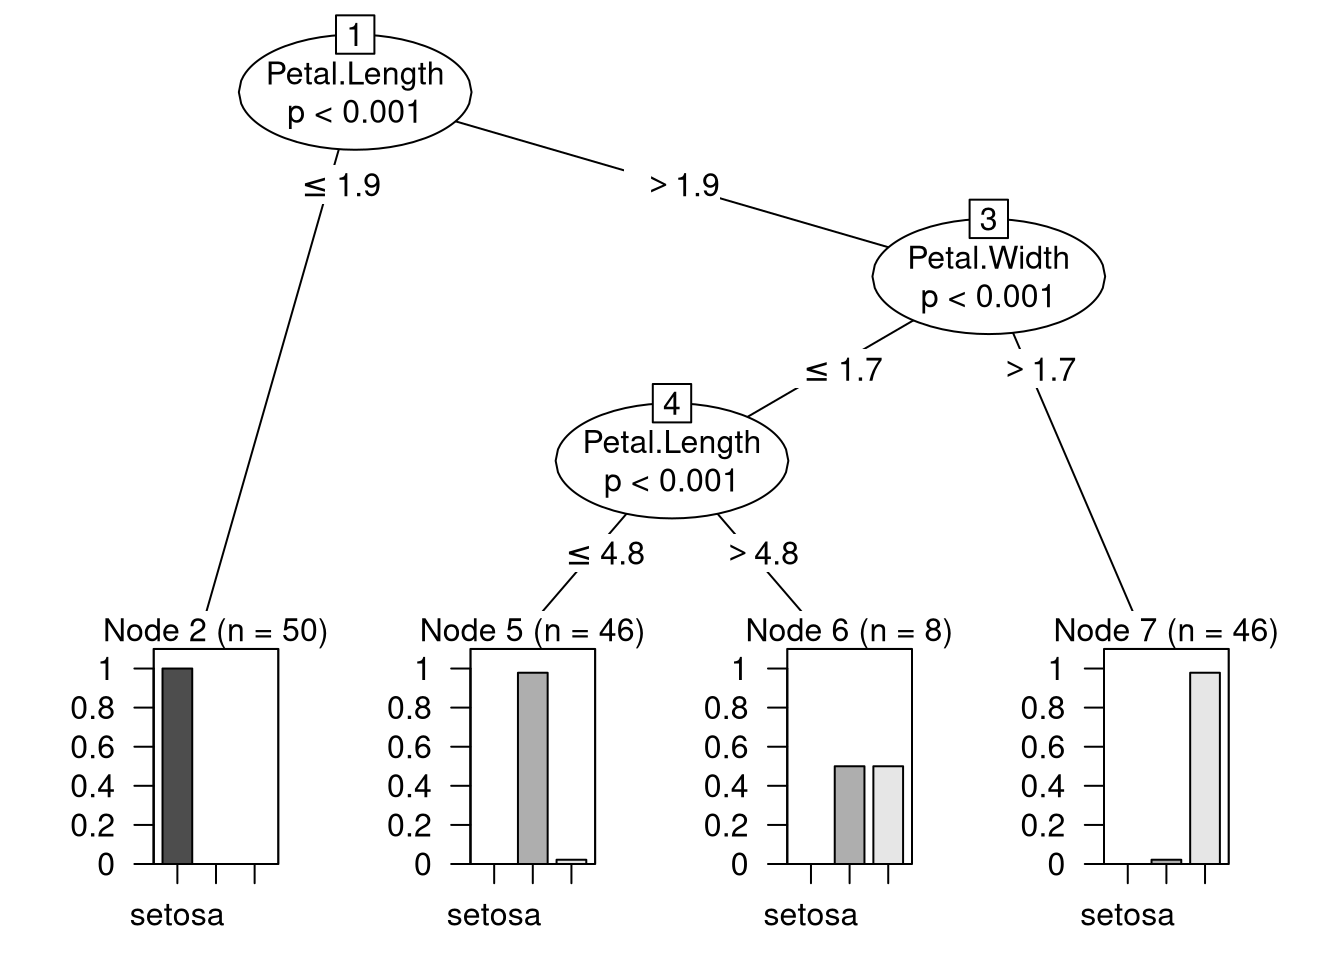
Stability assessment of variable and cutpoint selection in tree learners (i.e., recursive partitioning). By refitting trees to resampled versions of the learning data, the stability of the trees structure is assessed and can be summarized and visualized.
fitted model object. Any tree-based model object that can be coerced by as.party can be used provided that suitable methods are provided.
data
an optional data.frame. By default the learning data from x is used (if this can be inferred from the getCall of x.
sampler
a resampling (generating) function. Either this should be a function of n that returns a matrix or a sampler generator like subsampling.
weights
an optional matrix of dimension n * B that can be used to weight the observations from the original learning data when the trees are refitted. If weight = NULL, the sampler will be used.
applyfun
a lapply-like function. The default is to use lapply unless cores is specified in which case mclapply is used (for multicore computations on platforms that support these).
cores
integer. The number of cores to use in multicore computations using mclapply (see above).
savetrees
logical. If TRUE, trees based on resampled data sets are returned.
…
further arguments passed to sampler.
Details
The function stabletree assesses the stability of tree learners (i.e., recursive partitioning methods) by refitting the tree to resampled versions of the learning data. By default, if data = NULL, the fitting call is extracted by getCall to infer the learning data. Subsequently, the sampler generates B resampled versions of the learning data, the tree is regrown with update, and (if necessary) coerced by as.party. For each of the resampled trees it is queried and stored which variables are selected for splitting and what the selected cutpoints are.
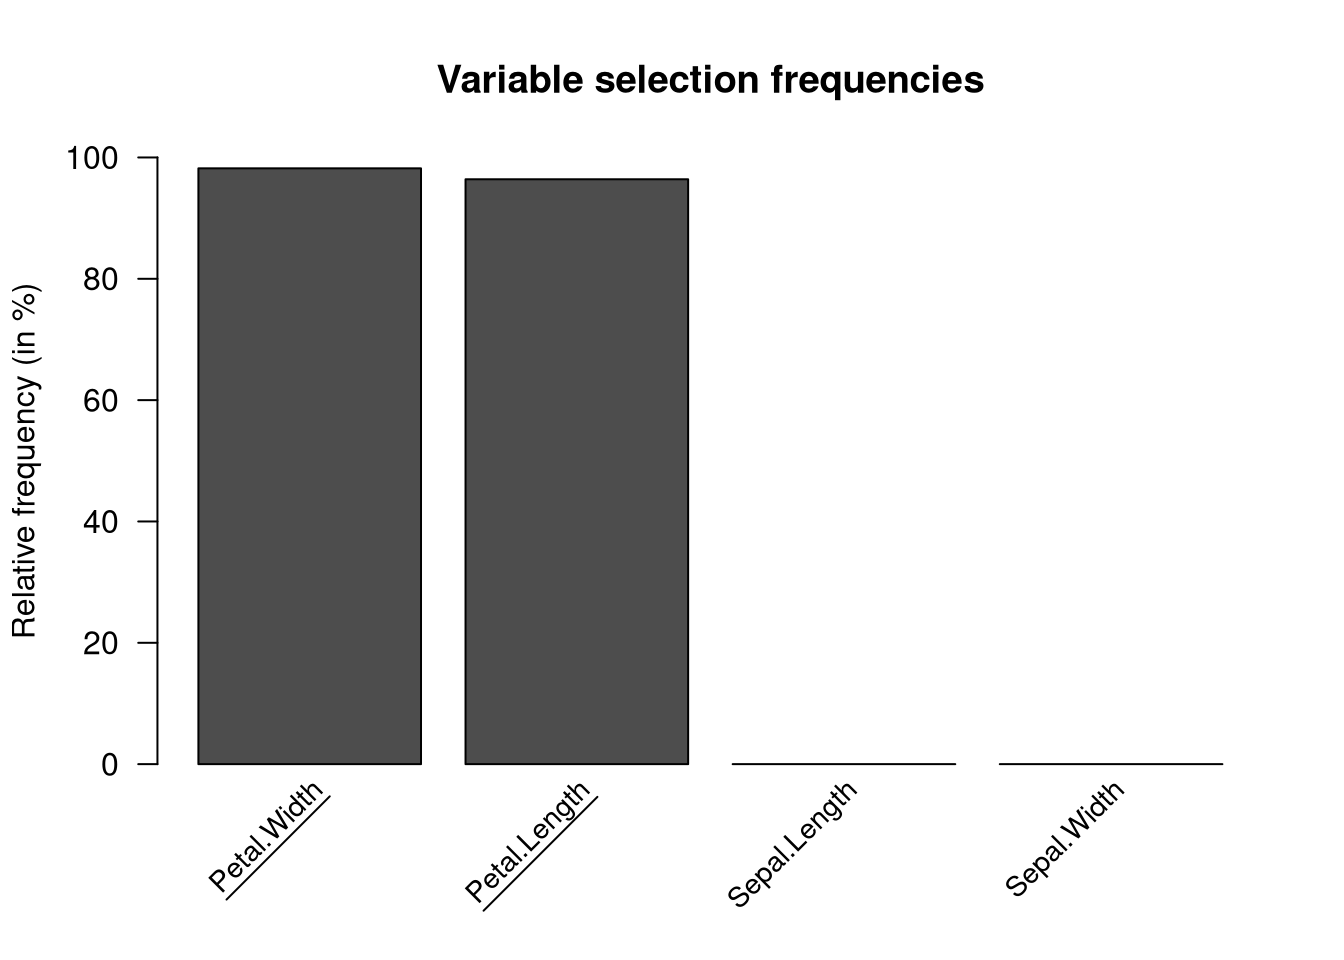
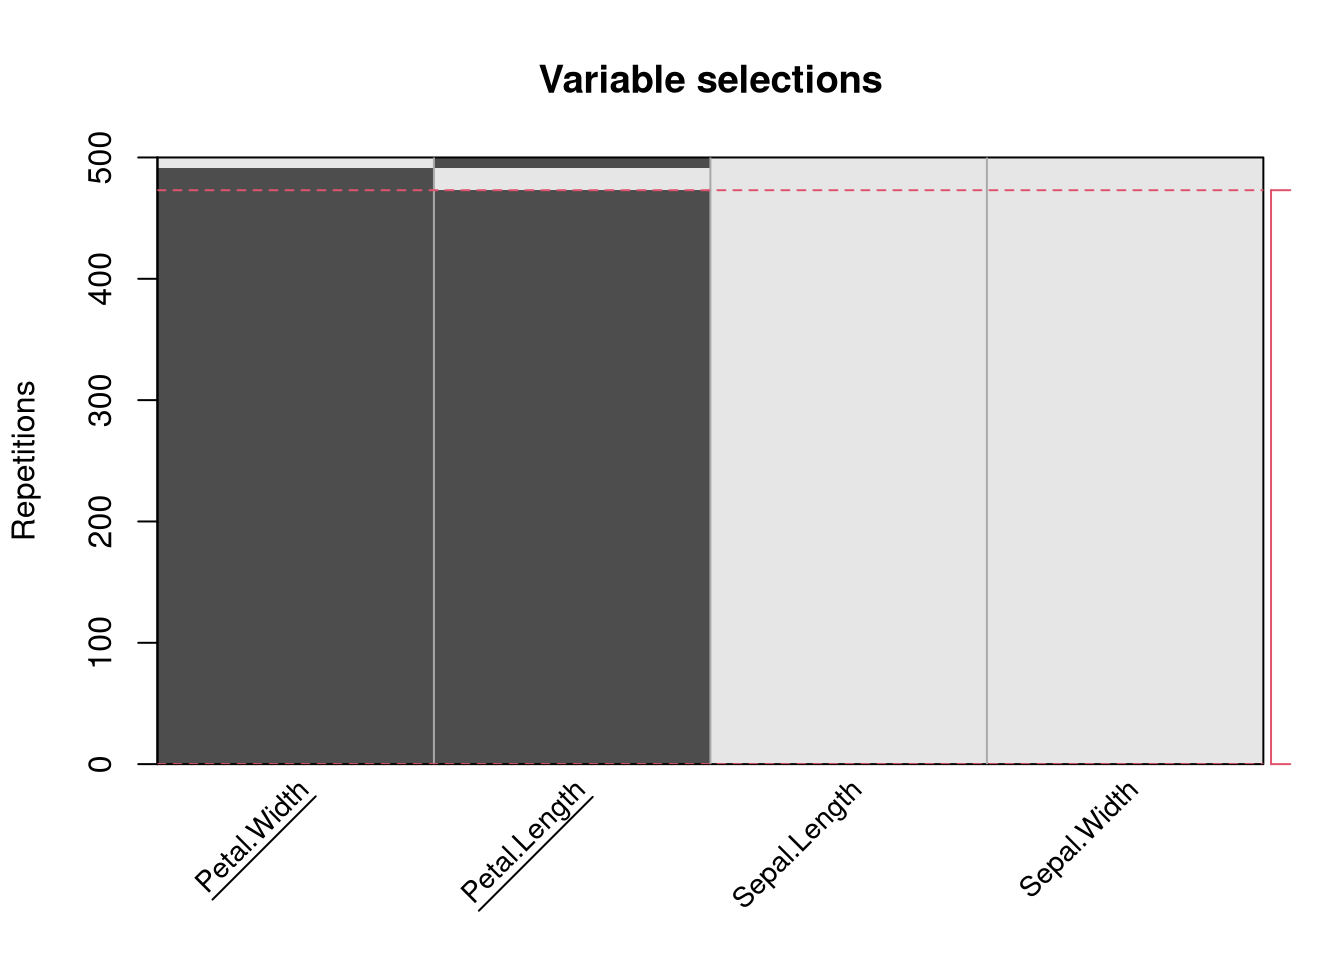
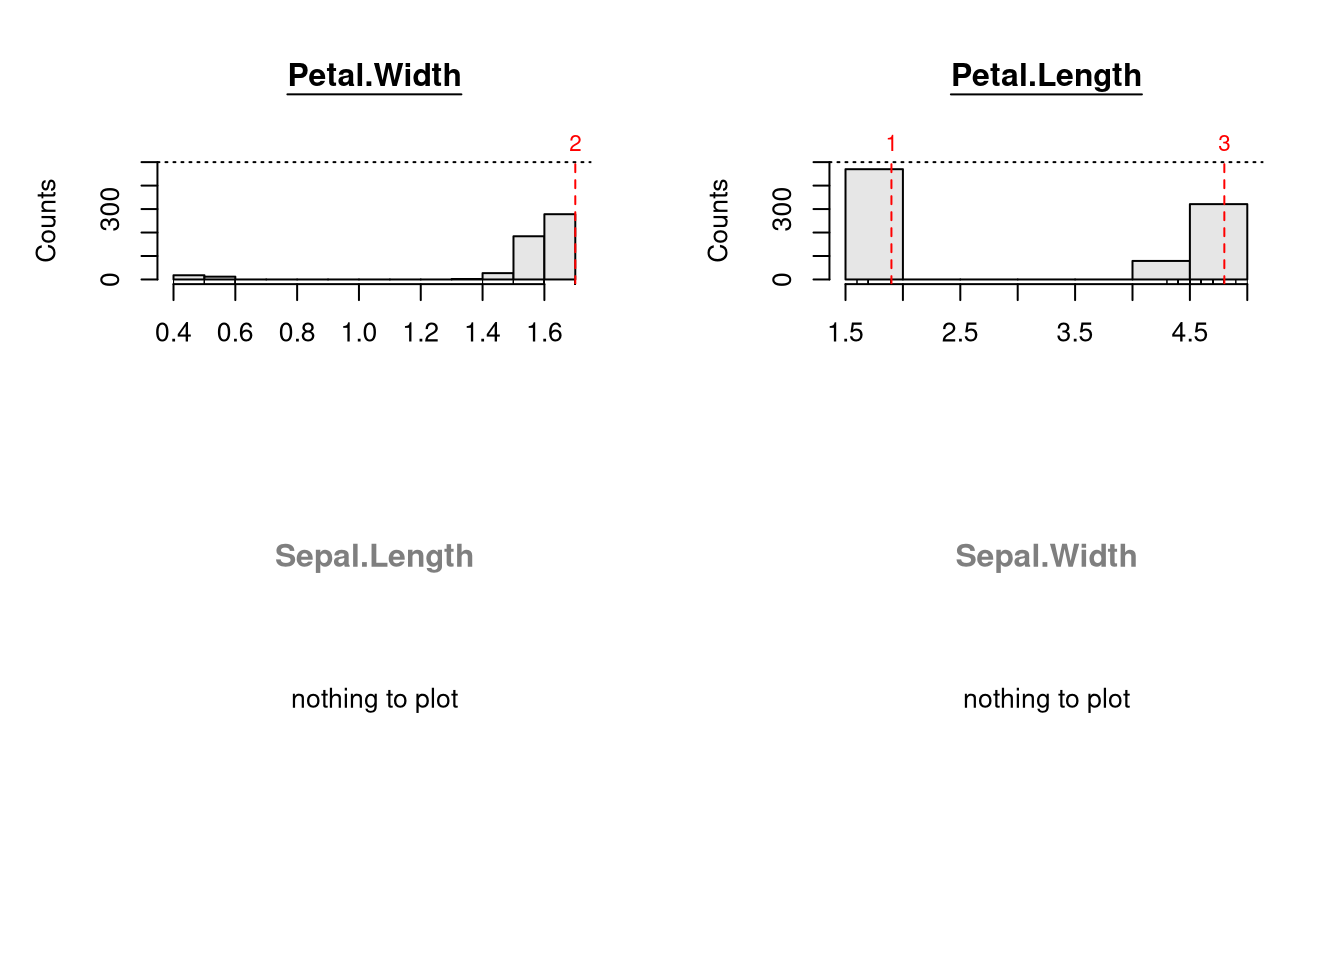
The resulting object of class “stabletree” comes with a set of standard methods to generic functions including print, summary for numerical summaries and plot, barplot, and image for graphical representations. See plot.stabletree for more details. In most methods, the argument original can be set to TRUE or FALSE, turning highlighting of the original tree information on and off.
Value
stabletree returns an object of class “stabletree” which is a list with the following components:
call
the call from the model object x,
B
the number of resampled datasets,
sampler
the sampler function,
vs0
numeric vector of the variable selections of the original tree,
br0
list of the break points (list of nodeids, levels, and breaks) for each variable of the original tree,
vs
numeric matrix of the variable selections for each resampled dataset,
br
list of the break points (only the breaks for each variable over all resampled datasets,
classes
character vector indicating the classes of all partitioning variables,
trees
a list of tree objects of class “party”, or NULL.
References
Hothorn T, Zeileis A (2015). partykit: A Modular Toolkit for Recursive Partytioning in R. Journal of Machine Learning Research, 16(118), 3905–3909.
Philipp M, Zeileis A, Strobl C (2016). “A Toolkit for Stability Assessment of Tree-Based Learners”. In A. Colubi, A. Blanco, and C. Gatu (Eds.), Proceedings of COMPSTAT 2016 – 22nd International Conference on Computational Statistics (pp. 315–325). The International Statistical Institute/International Association for Statistical Computing. Preprint available at https://EconPapers.RePEc.org/RePEc:inn:wpaper:2016-11