Illustrate Results from Stability Assessment
Description
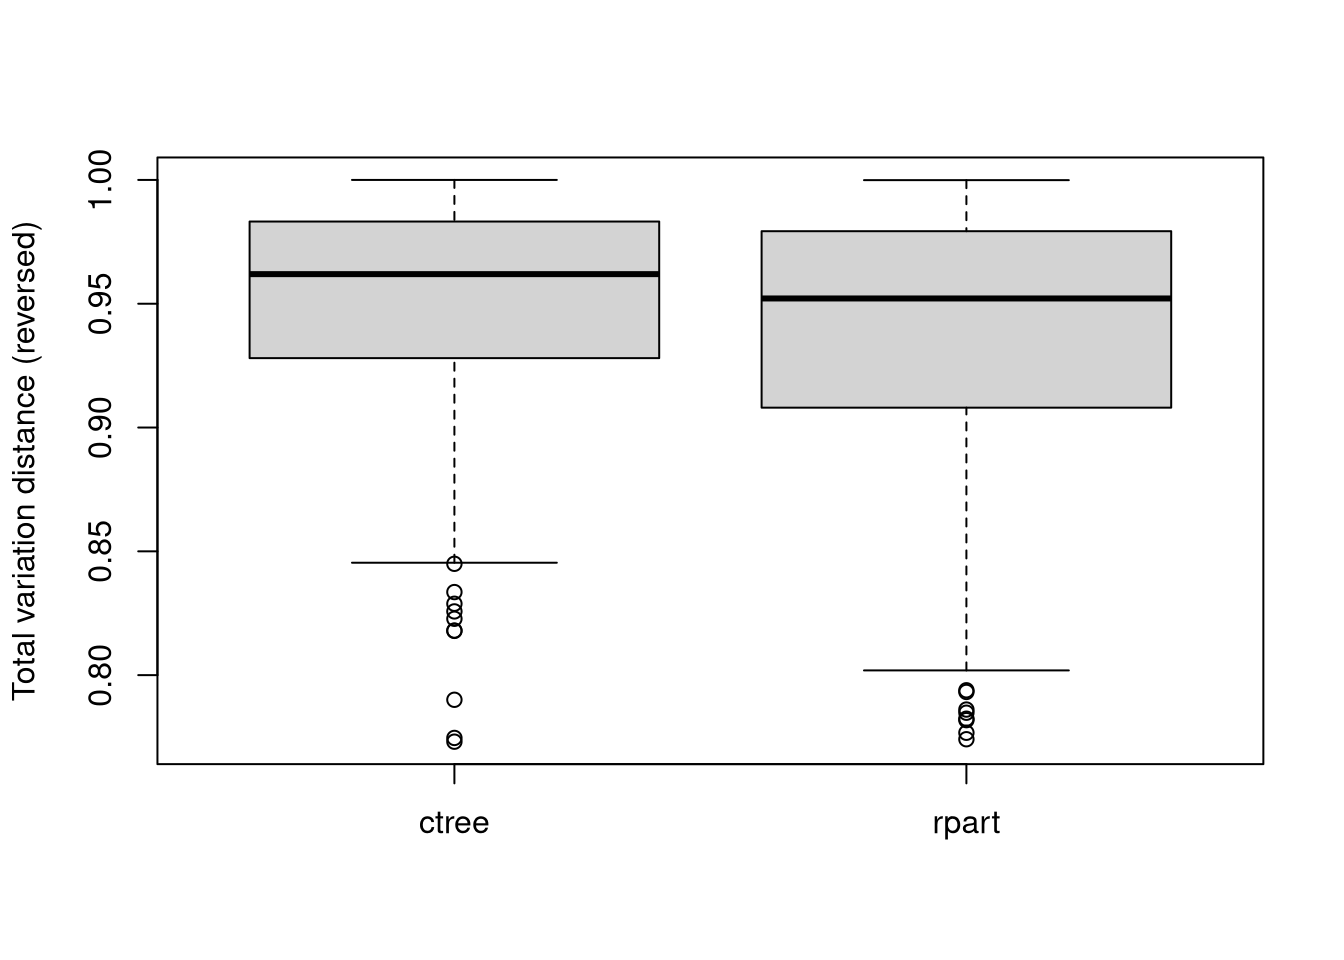
Illustrates the results from stability assessments performed by stability using boxplots.
Usage
  ## S3 method for class 'stablelearnerList'
boxplot(x, ..., main = NULL, xlab = NULL, ylab = NULL, reverse = TRUE)
  ## S3 method for class 'stablelearner'
boxplot(x, ...)
Arguments
x
|
an object of class “stablelearnerList” to be illustrated.
|
…
|
Arguments passed to boxplot.
|
main
|
a character specifying the title. By default set to NULL.
|
xlab
|
a character specifying the title for the x axis. By default set to “Learner”.
|
ylab
|
a character specifying the title for the y axis. By default set to NULL.
|
reverse
|
logical. If reverse = TRUE (default), the similarity values are transformed (reversed) such that higher values indicate a higher stability.
|
See Also
stability, summary.stablelearnerList