Usage
## S3 method for class 'stabletree'
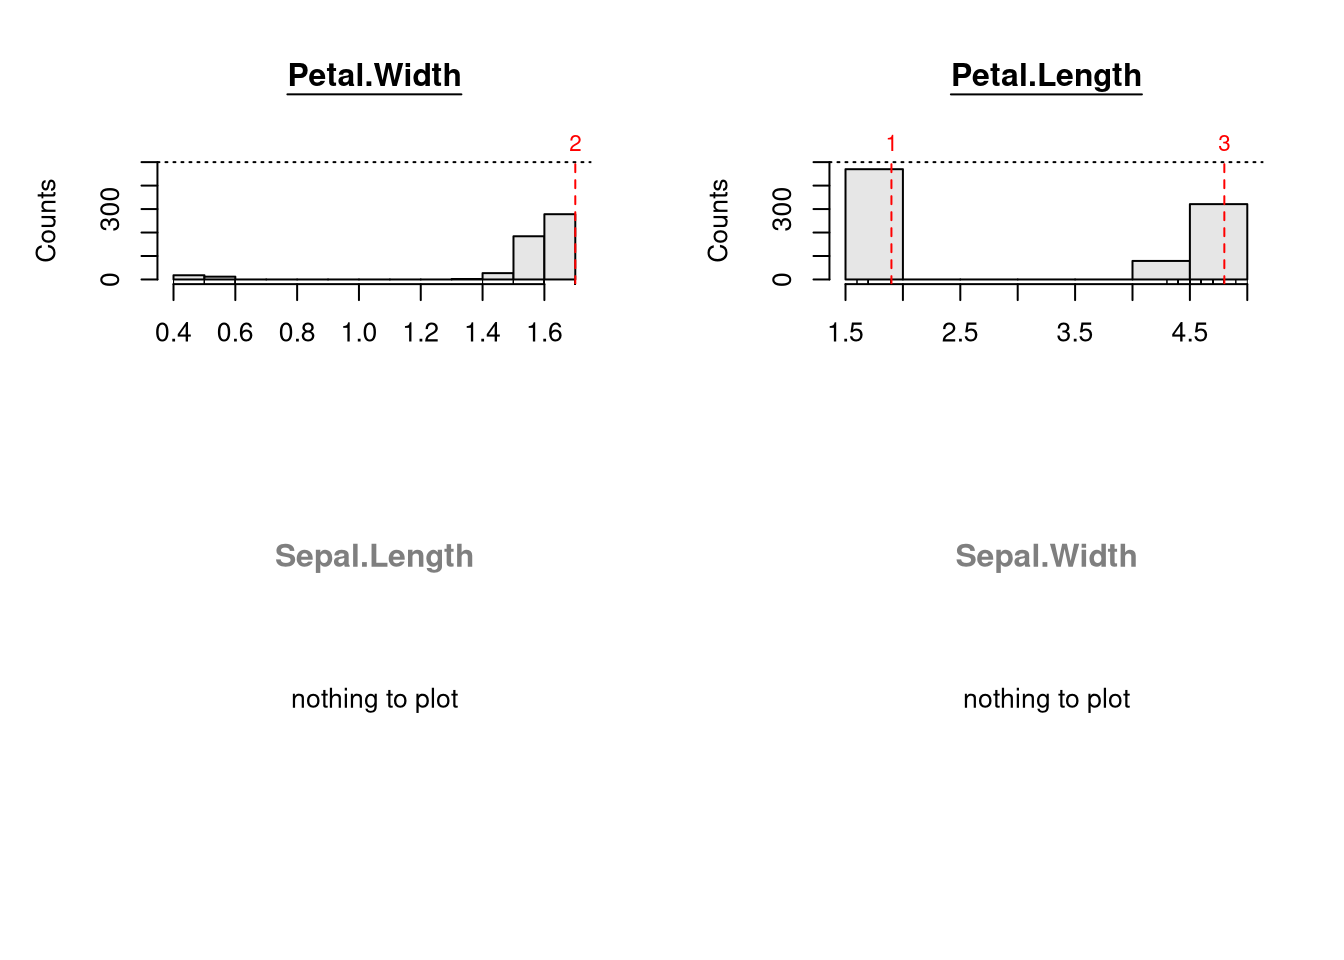
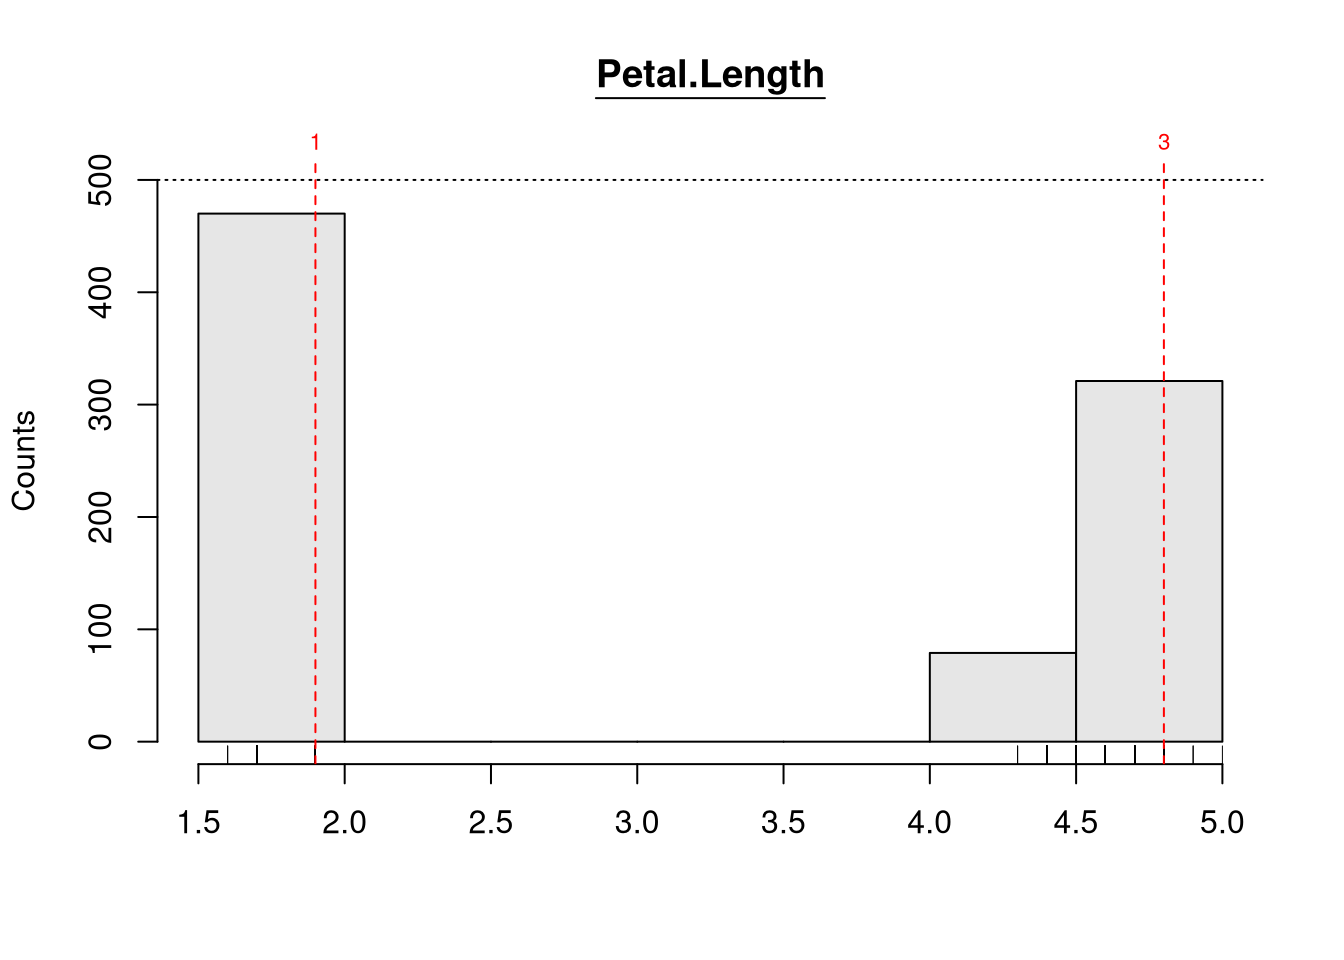
plot(x, select = order(colMeans(x\$vs), decreasing = TRUE),
  type.breaks = "levels", col.breaks = "red", lty.breaks = "dashed",
  cex.breaks = 0.7,  col.main = c("black", "gray50"), main.uline = TRUE,
  args.numeric = NULL, args.factor = NULL, args.ordered = NULL, main = NULL,
  original = TRUE, ...)

## S3 method for class 'stabletree'
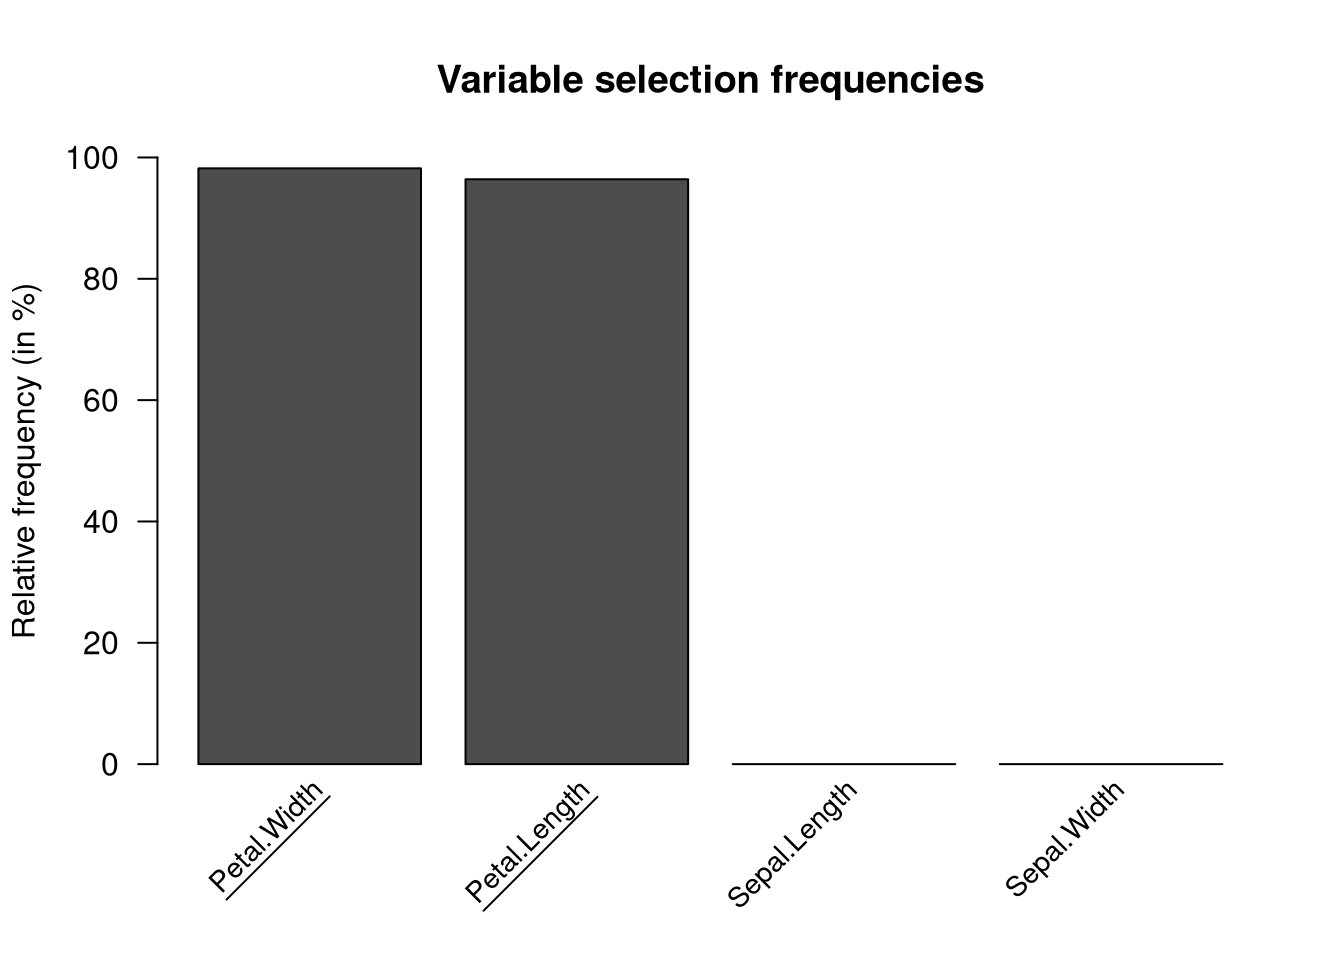
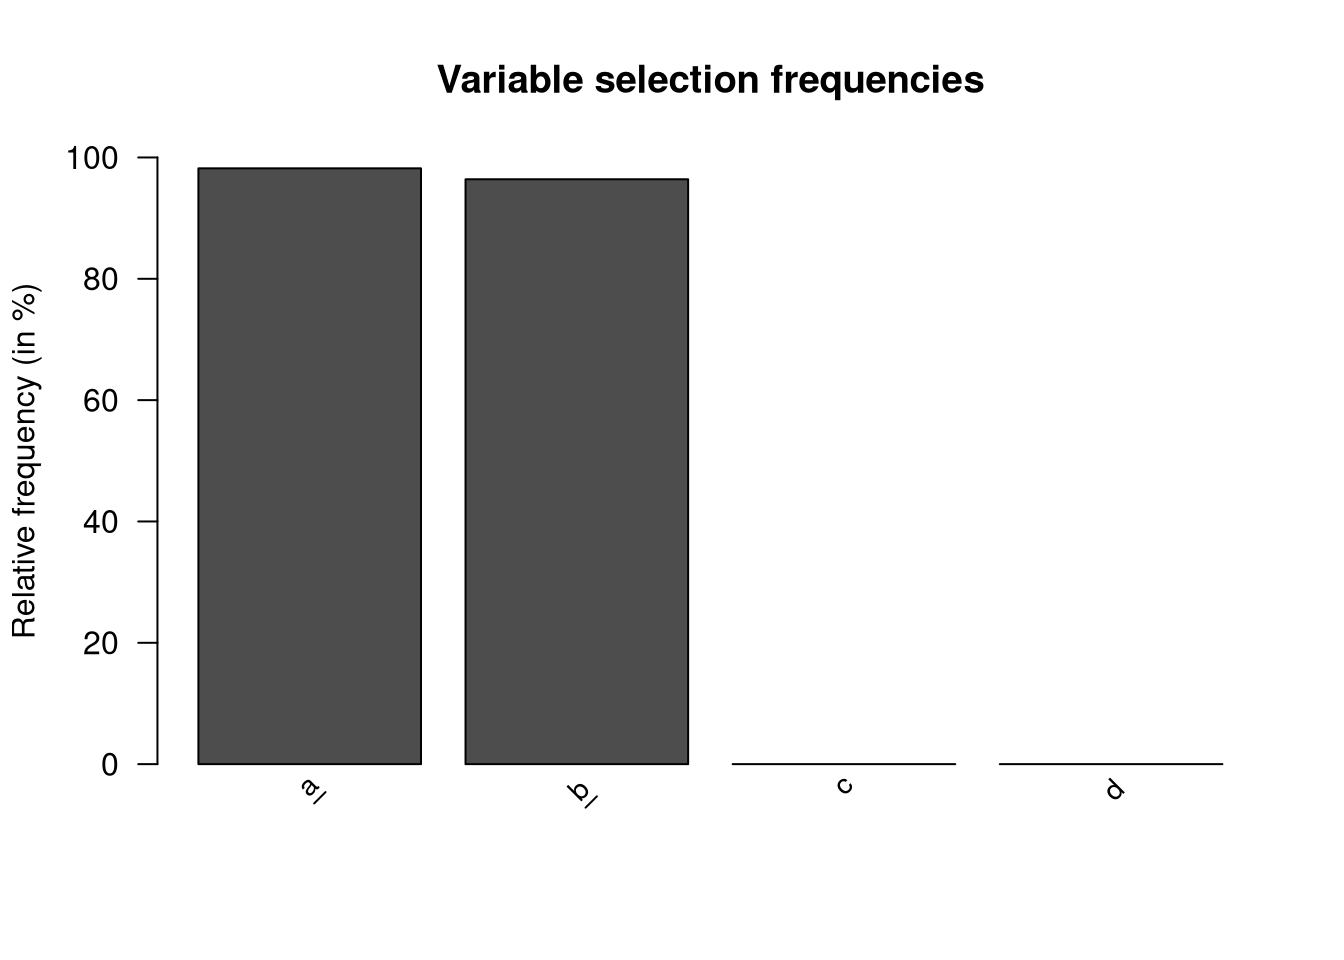
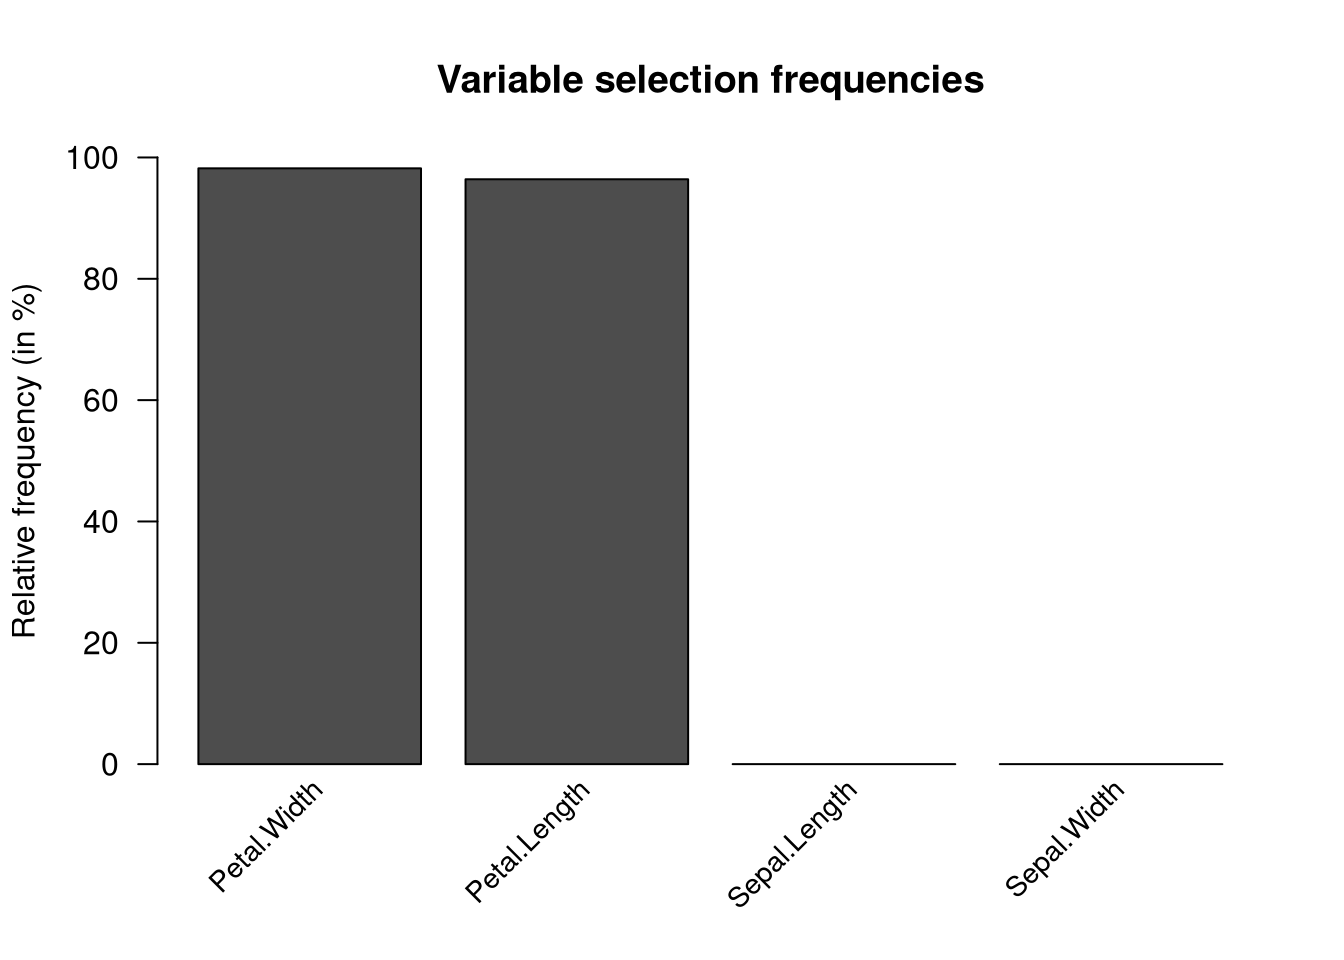
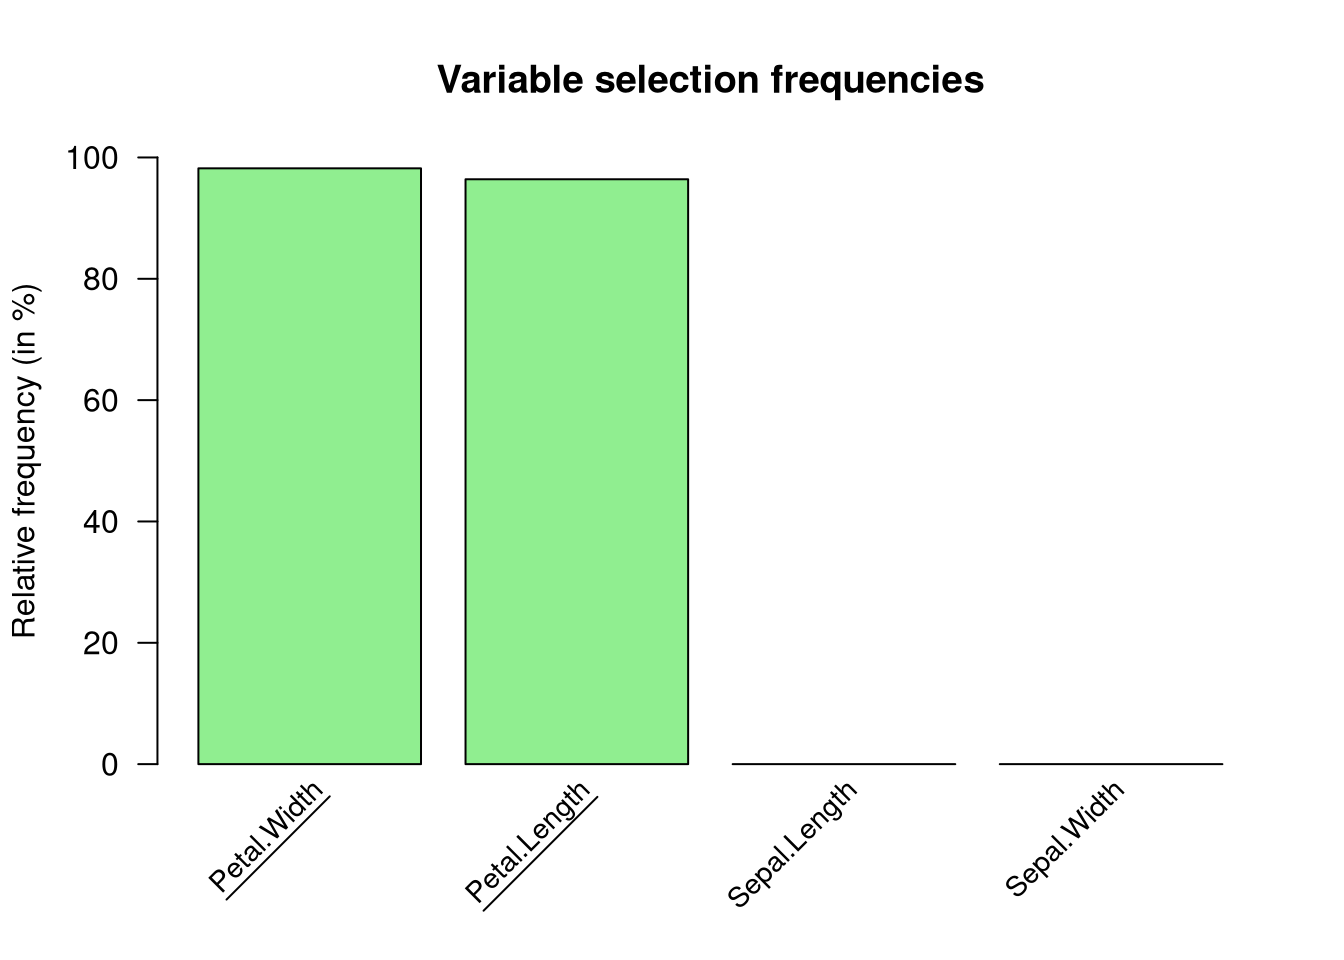
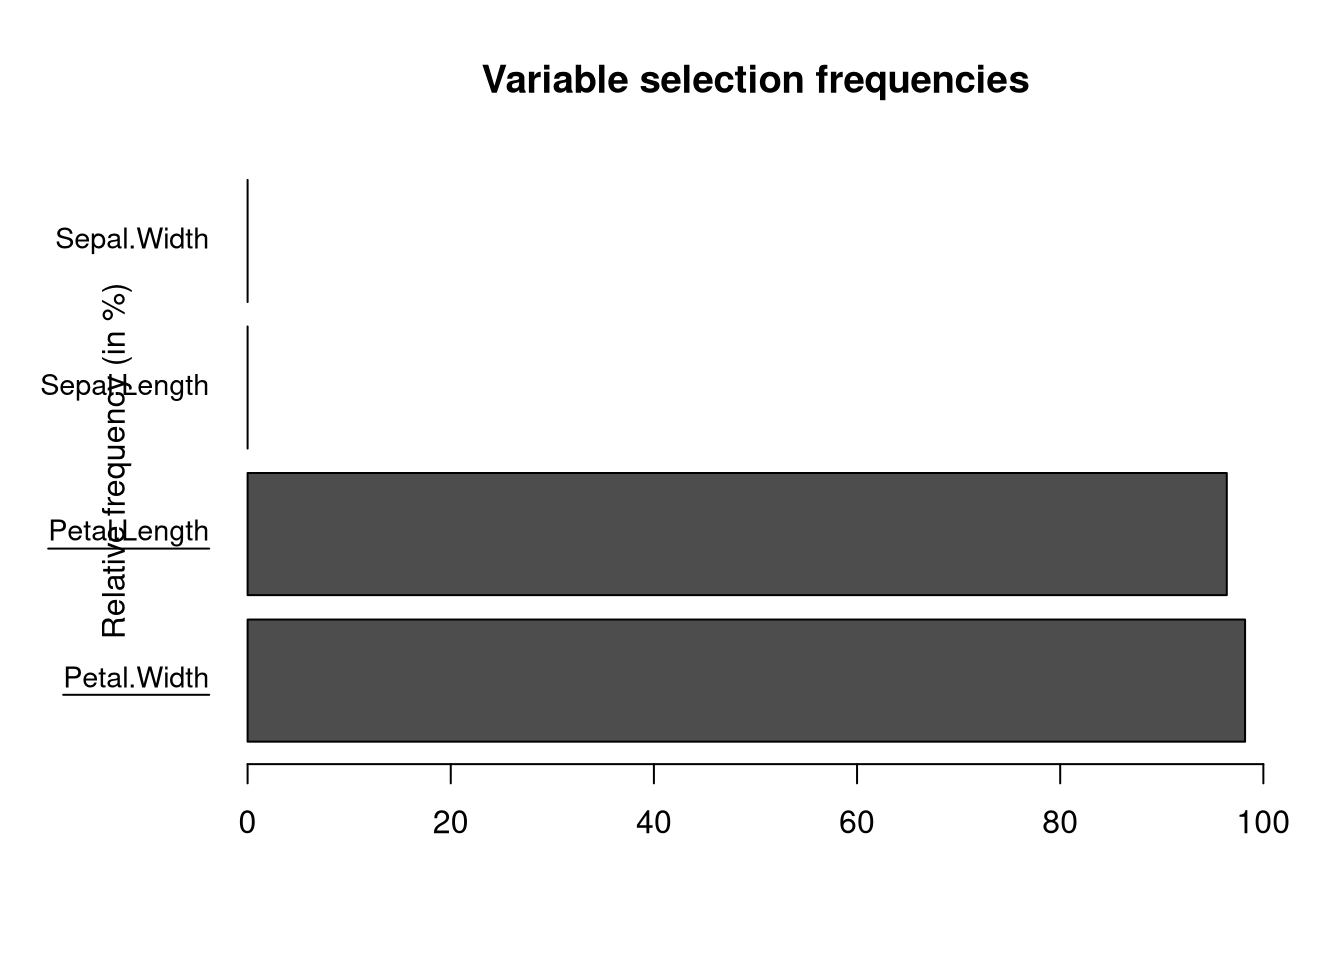
barplot(height, main = "Variable selection frequencies",
  xlab = "", ylab = "", horiz = FALSE, col = gray.colors(2),
  names.arg = NULL, names.uline = TRUE, names.diag = TRUE,
  cex.names = 0.9,
  ylim = if (horiz) NULL else c(0, 100), xlim = if (horiz) c(0, 100) else NULL,
  original = TRUE, ...)

## S3 method for class 'stabletree'
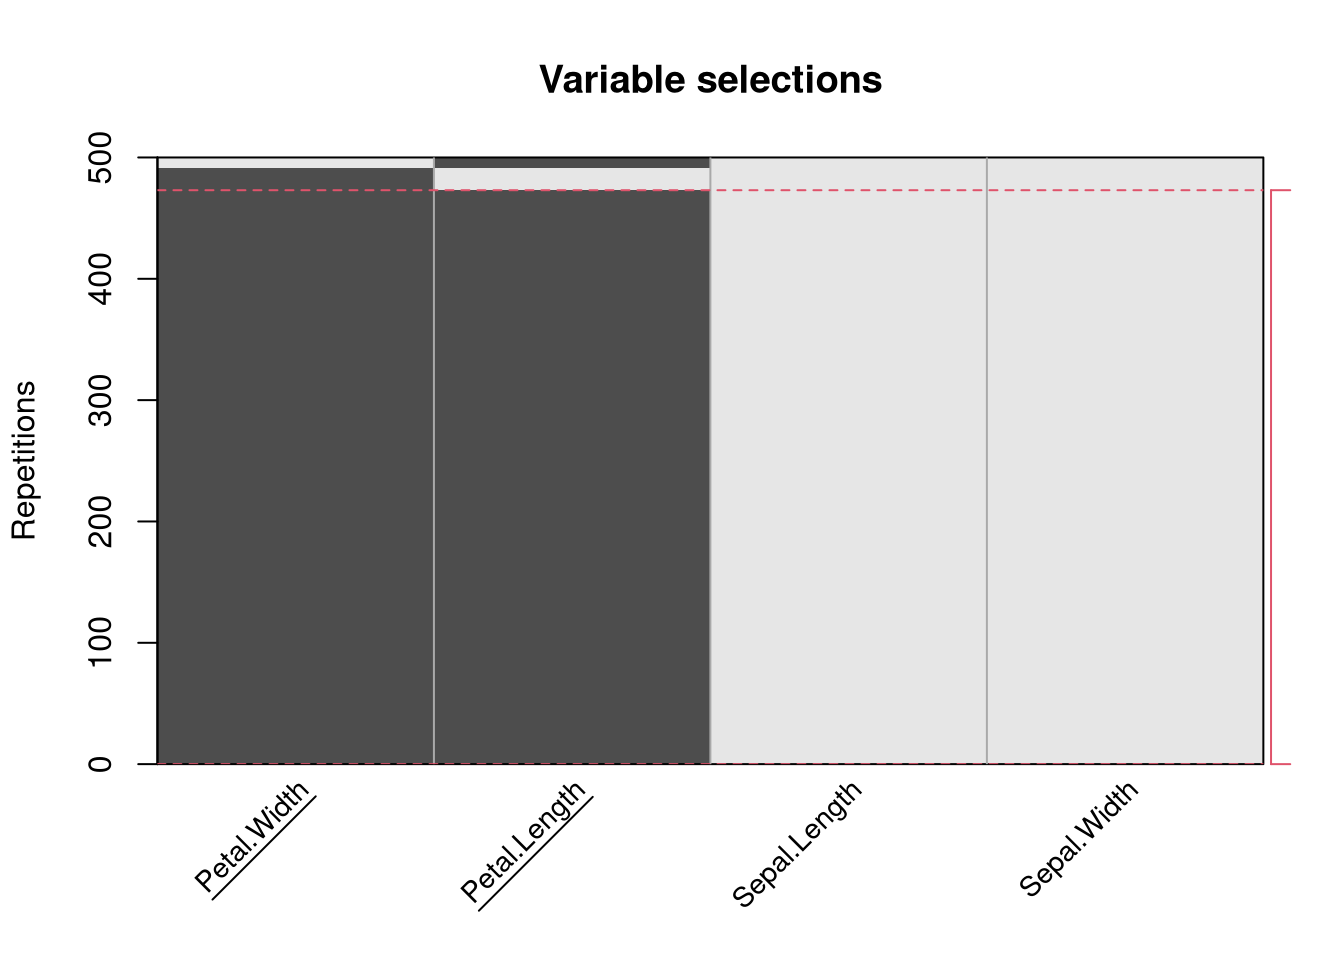
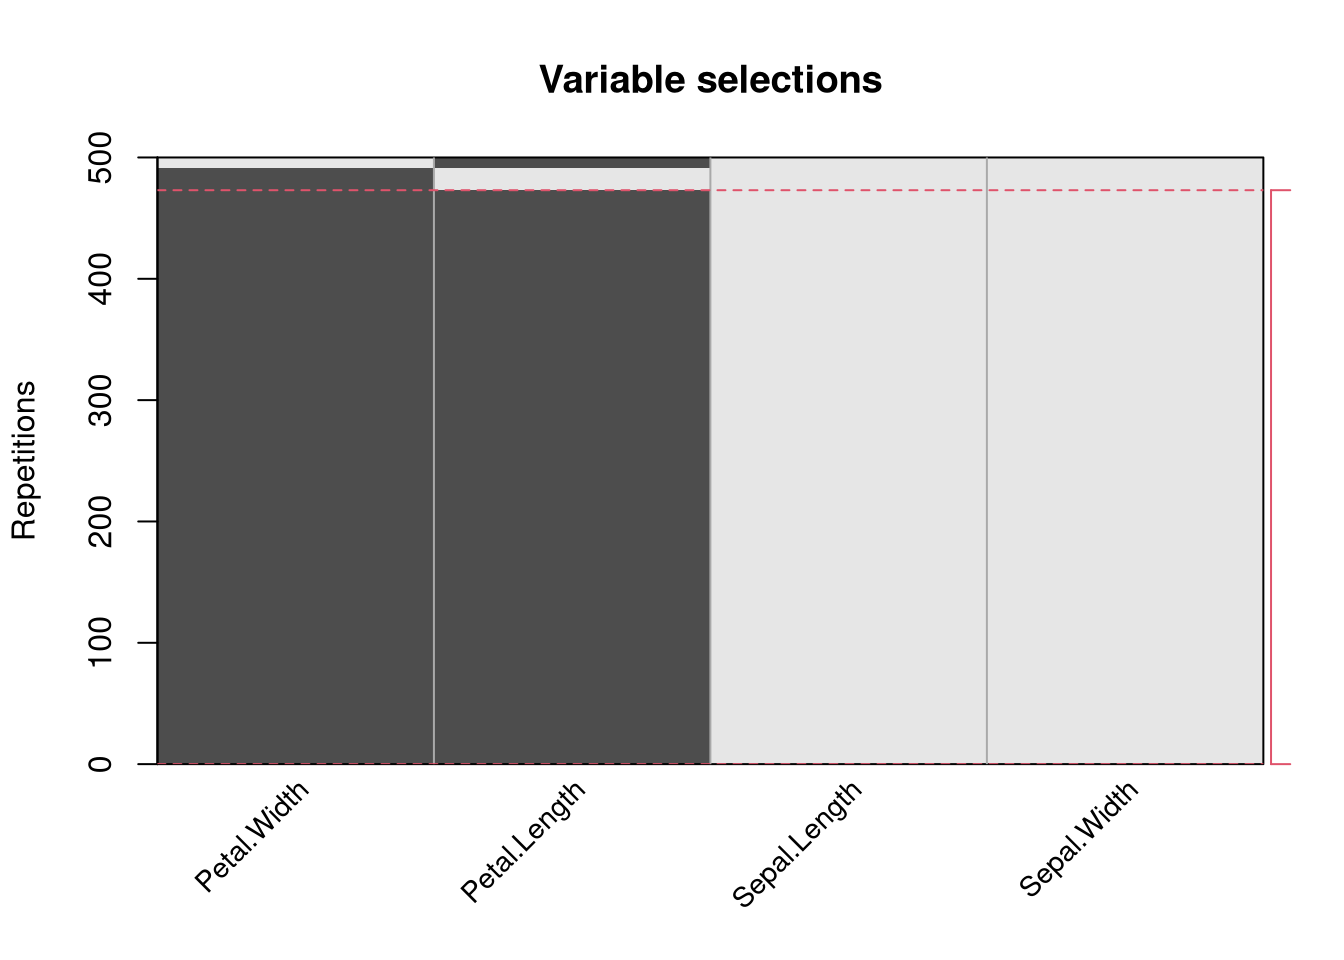
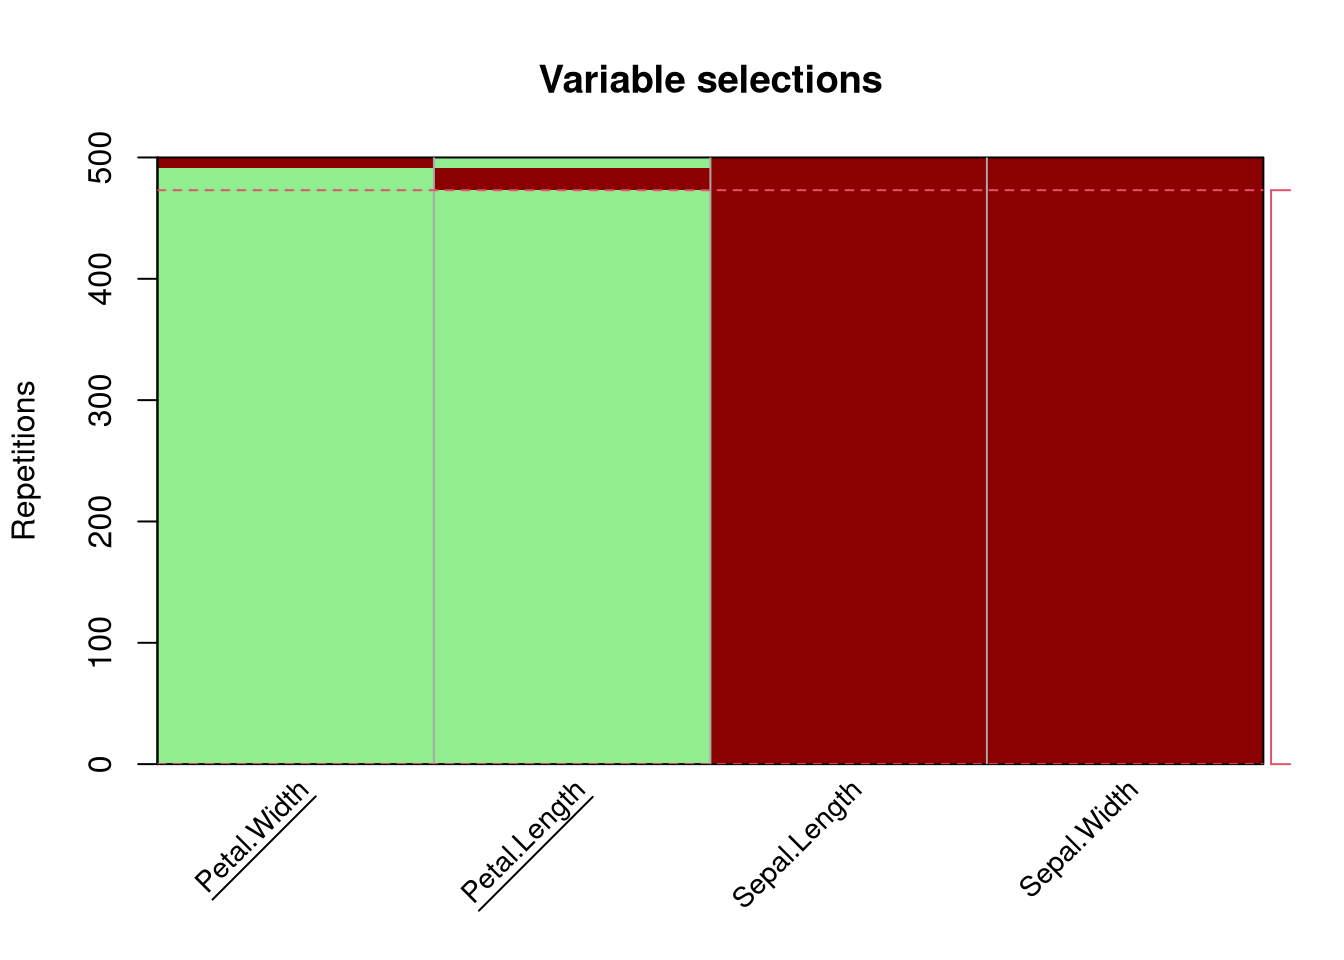
image(x, main = "Variable selections",
  ylab = "Repetitions", xlab = "", col = gray.colors(2),
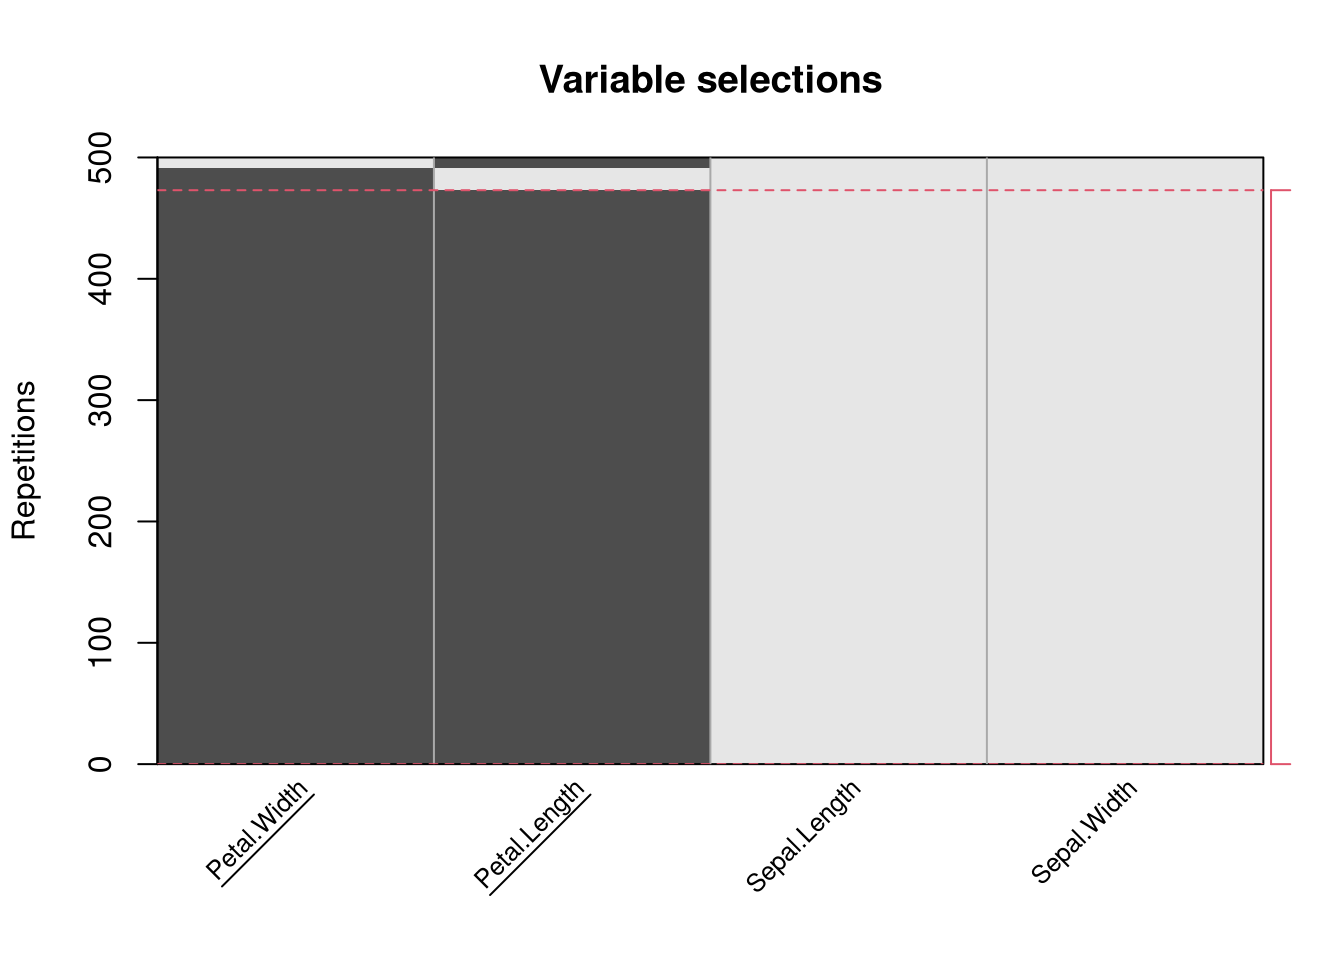
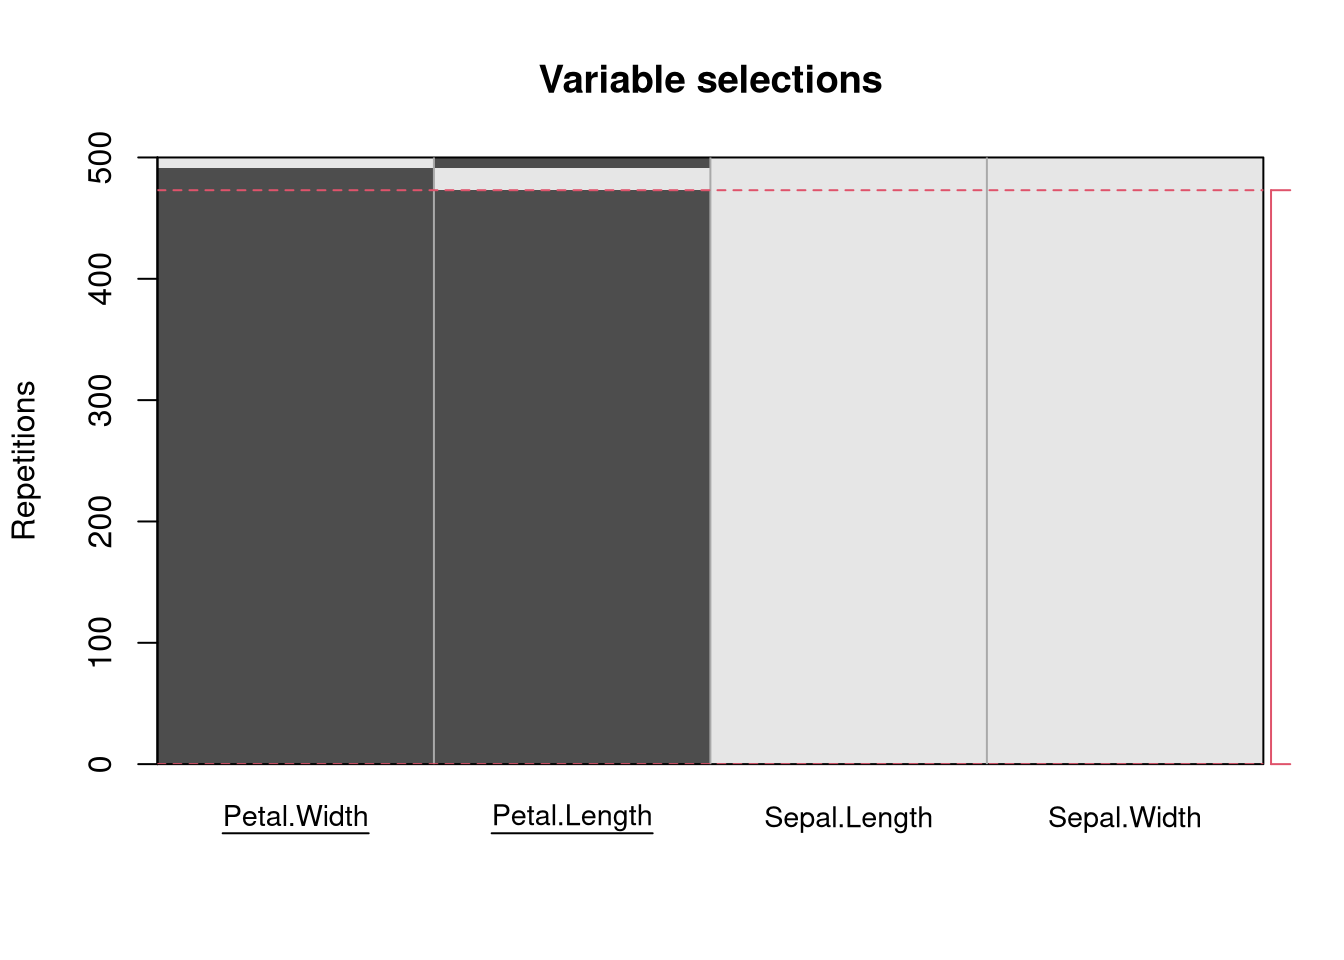
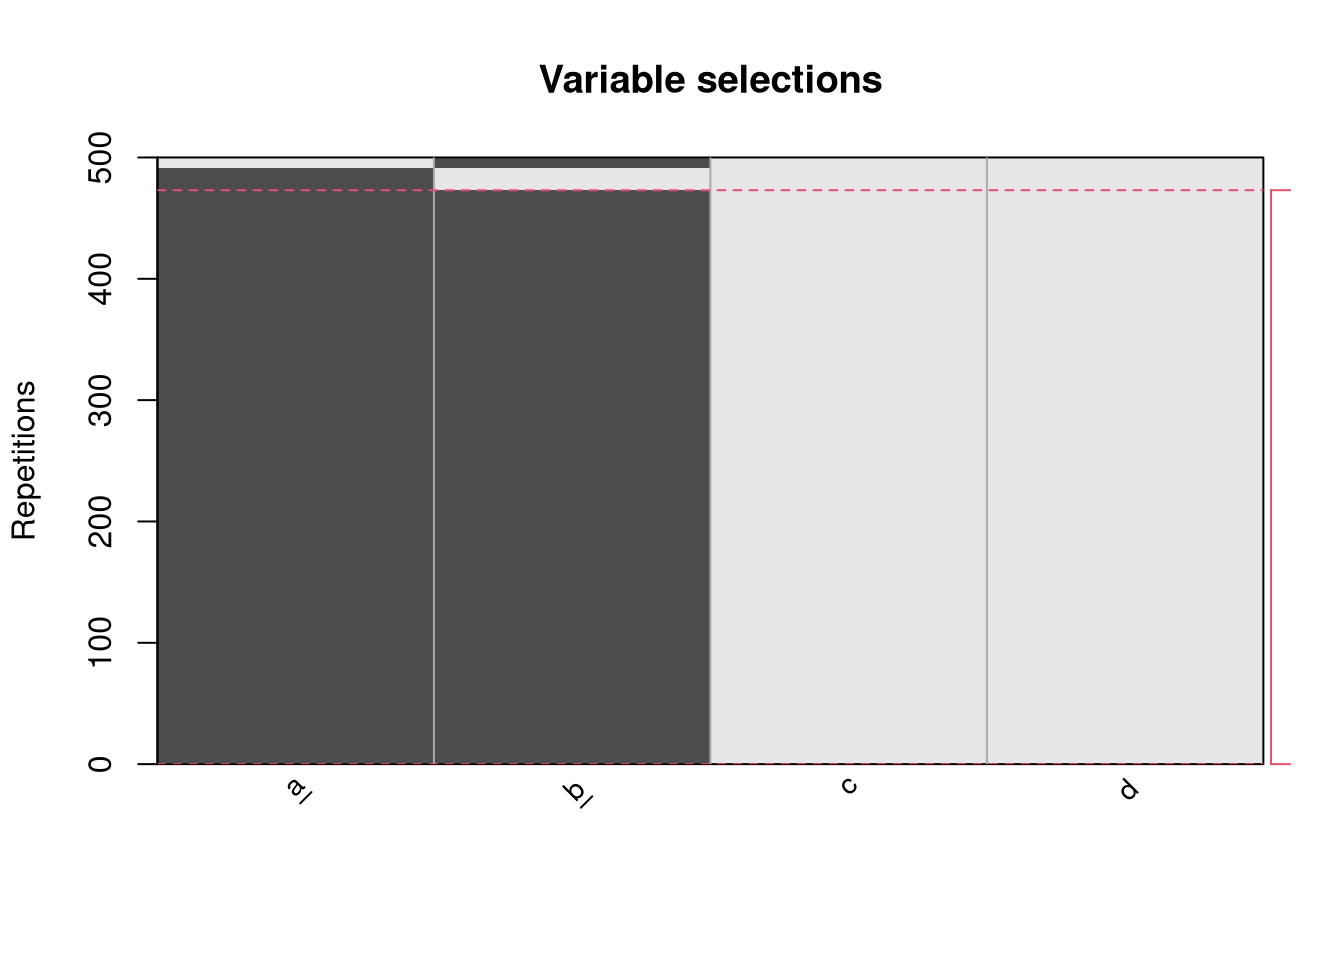
  names.arg = NULL, names.uline = TRUE, names.diag = TRUE,
  cex.names = 0.9, xaxs = "i", yaxs = "i",
  col.tree = 2, lty.tree = 2, xlim = c(0, length(x\$vs0)), ylim = c(0, x\$B),
  original = TRUE, ...)