number of observations. If length(n) > 1, the length is taken to be the number required.
location, scale, shape
location, scale, and shape parameters (see below).
log, log.p
logical; if TRUE, probabilities p are given as log(p).
lower.tail
logical; if TRUE (default), probabilities are \(P[X \le x]\), otherwise, \(P[X > x]\).
Details
If location, scale, or shape are omitted, they assume the default values of 0, 1, and 1, respectively.
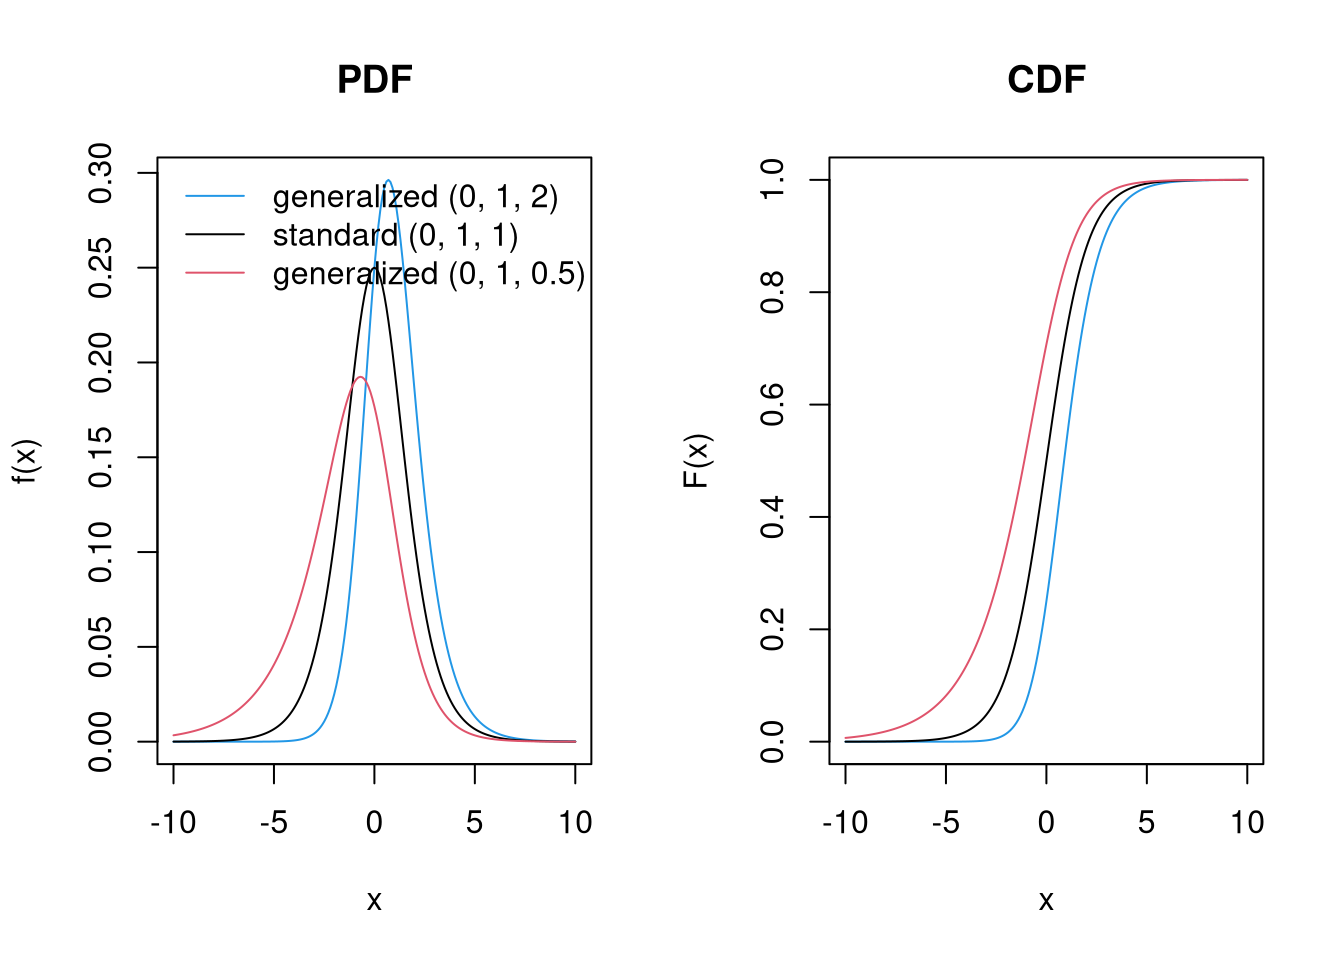
The generalized logistic distribution with location\(= \mu\), scale\(= \sigma\), and shape\(= \gamma\) has distribution function
F(x) = %
.
The mean is given by location + (digamma(shape) - digamma(1)) * scale, the variance by (psigamma(shape, deriv = 1) + psigamma(1, deriv = 1)) * scale^2) and the skewness by (psigamma(shape, deriv = 2) - psigamma(1, deriv = 2)) / (psigamma(shape, deriv = 1) + psigamma(1, deriv = 1))^(3/2)).
[dpq]glogis are calculated by leveraging the [dpq]logis and adding the shape parameter. rglogis uses inversion.
Value
dglogis gives the probability density function, pglogis gives the cumulative distribution function, qglogis gives the quantile function, and rglogis generates random deviates. sglogis gives the score function (gradient of the log-density with respect to the parameter vector).
References
Johnson NL, Kotz S, Balakrishnan N (1995) Continuous Univariate Distributions, volume 2. John Wiley & Sons, New York.
Shao Q (2002). Maximum Likelihood Estimation for Generalised Logistic Distributions. Communications in Statistics – Theory and Methods, 31(10), 1687–1700.
Windberger T, Zeileis A (2014). Structural Breaks in Inflation Dynamics within the European Monetary Union. Eastern European Economics, 52(3), 66–88.
Examples
library("glogis")## PDF and CDFpar(mfrow =c(1, 2))x<--100:100/10plot(x, dglogis(x, shape =2), type ="l", col =4, main ="PDF", ylab ="f(x)")lines(x, dglogis(x, shape =1))lines(x, dglogis(x, shape =0.5), col =2)legend("topleft", c("generalized (0, 1, 2)", "standard (0, 1, 1)","generalized (0, 1, 0.5)"), lty =1, col =c(4, 1, 2), bty ="n")plot(x, pglogis(x, shape =2), type ="l", col =4, main ="CDF", ylab ="F(x)")lines(x, pglogis(x, shape =1))lines(x, pglogis(x, shape =0.5), col =2)