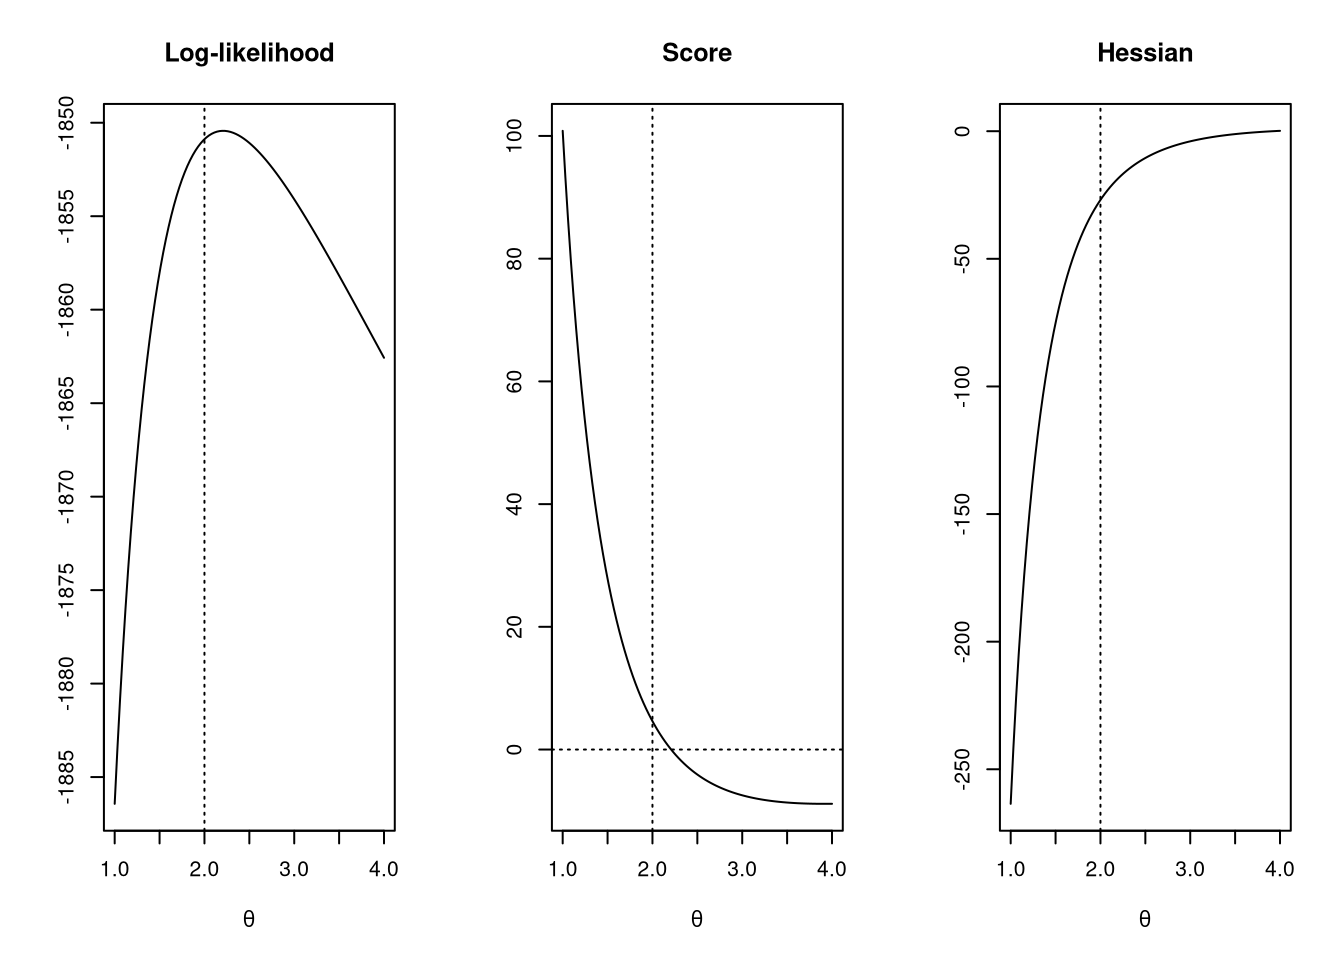
snbinom gives the score function, i.e., the 1st derivative of the log-density wrt mu or theta and hnbinom gives the hessian, i.e., the 2nd derivative of the log-density wrt mu and/or theta. mean and var give the mean and variance, respectively.
Note
No parameter prob—as in dnbinom, pnbinom, qnbinom and rnbinom—is implemented in the functions snbinom and hnbinom.
See Also
NegBinomial encompassing dnbinom, pnbinom, qnbinom and rnbinom.
Examples
library("countreg")## Simulate some dataset.seed(123)y<-rnbinom(1000, size =2, mu =2)## Plot log-likelihood functionpar(mfrow =c(1, 3))ll<-function(x){sum(dnbinom(y, size =x, mu =2, log =TRUE))}curve(sapply(x, ll), 1, 4, xlab =expression(theta), ylab ="", main ="Log-likelihood")abline(v =2, lty =3)## Plot score functioncurve(sapply(x, function(x)sum(snbinom(y, size =x, mu =2, parameter ="size"))),1, 4, xlab =expression(theta), ylab ="", main ="Score")abline(h =0, lty =3)abline(v =2, lty =3)## Plot hessiancurve(sapply(x, function(x)sum(hnbinom(y, size =x, mu =2, parameter ="size"))),1, 4, xlab =expression(theta), ylab ="", main ="Hessian")abline(v =2, lty =3)