library("countreg")

## Load data and omit NAs and one dmfs outlier
data("OralHealthNL", package = "countreg")
head(OralHealthNL)
dmfs education gender ethnicity brushing breakfast fooddrink corah
1 1 low male native >= 2 7 <= 7 <NA>
2 0 high male native >= 2 7 <= 7 <NA>
3 6 high female native >= 2 7 <= 7 < 13
4 9 low female native >= 2 7 > 7 < 13
5 0 high female native < 2 7 <= 7 <NA>
6 0 low male native >= 2 7 <= 7 < 13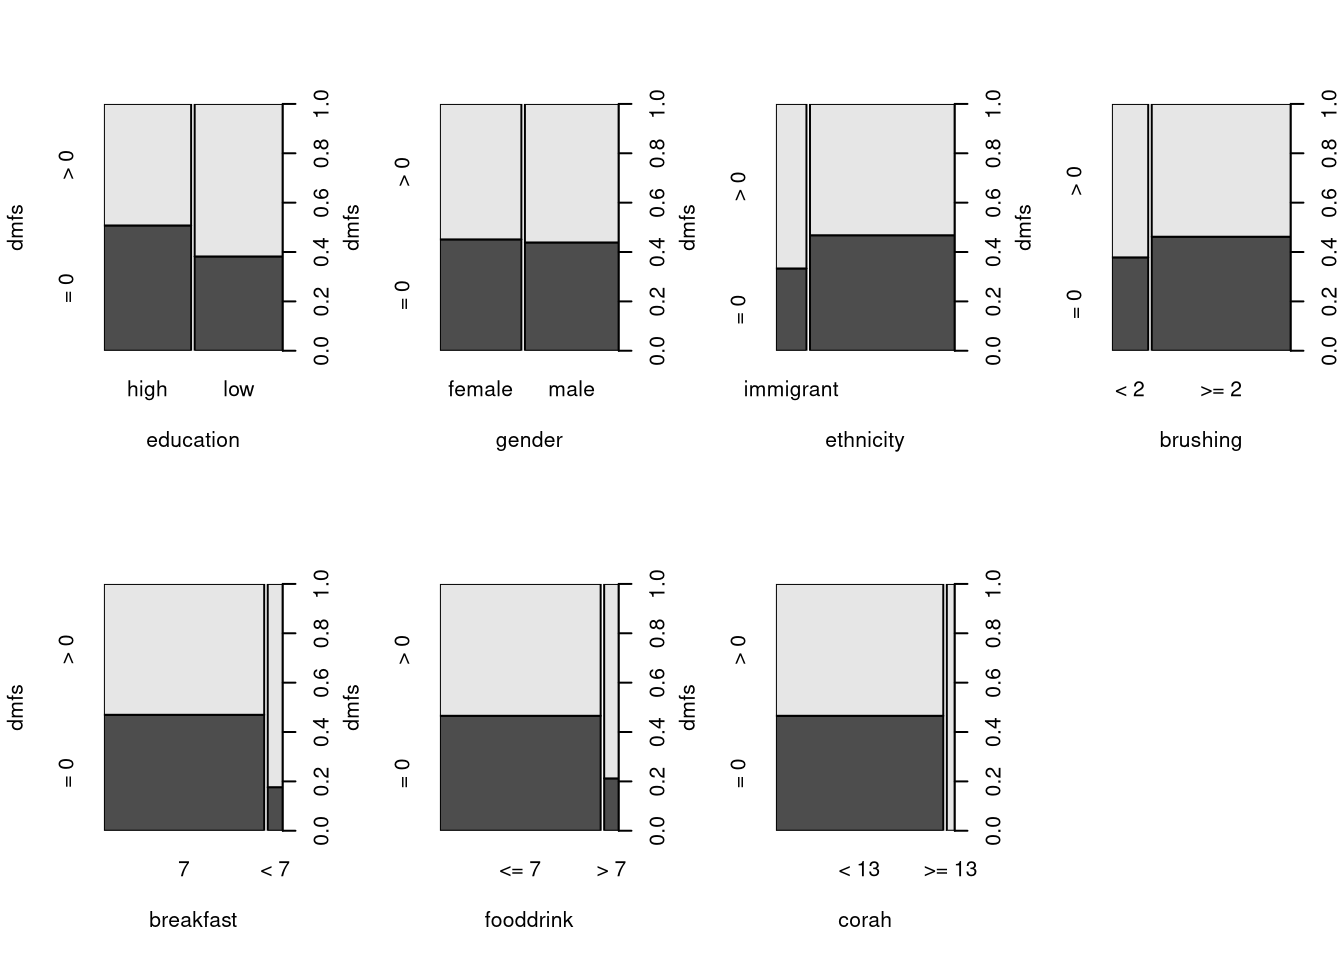
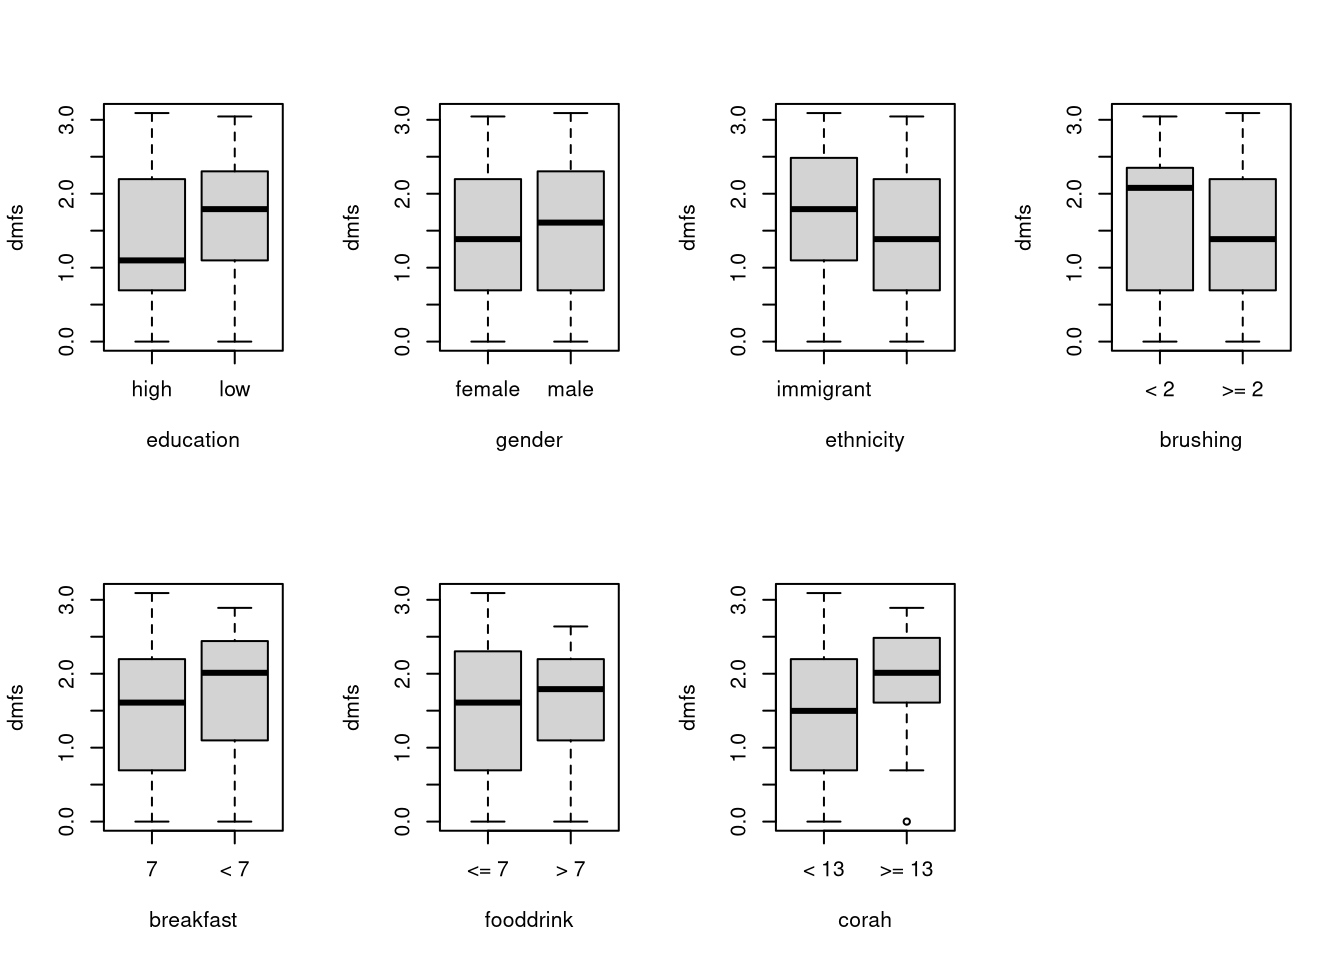
plot(log(dmfs) ~ ., data = OralHealthNL, subset = dmfs > 0, ylab = "dmfs")

## Relevel the factor variables so that non-risk group is the reference
OralHealthNL <- transform(OralHealthNL,
  ethnicity = relevel(ethnicity, ref = "native"),
  brushing = relevel(brushing, ref = ">= 2"),
  breakfast = relevel(breakfast, ref = "7")
)

## Count regression models
zinb <- zeroinfl(dmfs ~ ., data = OralHealthNL, dist = "negbin")
zip  <- zeroinfl(dmfs ~ ., data = OralHealthNL, dist = "poisson")
hnb  <-   hurdle(dmfs ~ ., data = OralHealthNL, dist = "negbin")
hp   <-   hurdle(dmfs ~ ., data = OralHealthNL, dist = "poisson")

## Model comparisons (Table 3)
## Information criteria
cbind(AIC(hnb, zinb, hp, zip), BIC = BIC(hnb, zinb, hp, zip)[, 2])
df AIC BIC
hnb 17 1710.477 1778.161
zinb 17 1712.954 1780.638
hp 16 1969.529 2033.232
zip 16 1969.571 2033.274Likelihood ratio test
Model 1: dmfs ~ .
Model 2: dmfs ~ .
#Df LogLik Df Chisq Pr(>Chisq)
1 17 -838.24
2 16 -968.76 -1 261.05 < 2.2e-16 ***
---
Signif. codes: 0 '***' 0.001 '**' 0.01 '*' 0.05 '.' 0.1 ' ' 1Likelihood ratio test
Model 1: dmfs ~ .
Model 2: dmfs ~ .
#Df LogLik Df Chisq Pr(>Chisq)
1 17 -839.48
2 16 -968.79 -1 258.62 < 2.2e-16 ***
---
Signif. codes: 0 '***' 0.001 '**' 0.01 '*' 0.05 '.' 0.1 ' ' 1## Zero-inflation vs. hurdle
if(require("nonnest2")) vuongtest(zinb, hnb)
Model 1
 Class: zeroinfl
 Call: zeroinfl(formula = dmfs ~ ., data = OralHealthNL, dist = "negbin")

Model 2
 Class: hurdle
 Call: hurdle(formula = dmfs ~ ., data = OralHealthNL, dist = "negbin")

Variance test
  H0: Model 1 and Model 2 are indistinguishable
  H1: Model 1 and Model 2 are distinguishable
    w2 = 0.001,   p = 0.382

Non-nested likelihood ratio test
  H0: Model fits are equal for the focal population
  H1A: Model 1 fits better than Model 2
    z = -2.511,   p = 0.994
  H1B: Model 2 fits better than Model 1
    z = -2.511,   p = 0.006015
## Coefficients, odds ratios, and rate ratios
## Negative binomial hurdle model (Table 3)
summary(hnb)
Call:
hurdle(formula = dmfs ~ ., data = OralHealthNL, dist = "negbin")

Pearson residuals:
    Min      1Q  Median      3Q     Max
-1.0564 -0.6754 -0.4458  0.3831  4.2094

Count model coefficients (truncated negbin with log link):
                   Estimate Std. Error z value Pr(>|z|)
(Intercept)         1.29286    0.13110   9.861  < 2e-16 ***
educationlow        0.30434    0.12956   2.349  0.01883 *
gendermale          0.05017    0.12481   0.402  0.68772
ethnicityimmigrant  0.33572    0.15078   2.227  0.02598 *
brushing< 2         0.37770    0.14319   2.638  0.00835 **
breakfast< 7        0.13758    0.18510   0.743  0.45732
fooddrink> 7       -0.08250    0.19674  -0.419  0.67497
corah>= 13          0.38452    0.22072   1.742  0.08148 .
Log(theta)          0.51214    0.18669   2.743  0.00608 **
Zero hurdle model coefficients (binomial with logit link):
                    Estimate Std. Error z value Pr(>|z|)
(Intercept)         -0.32742    0.19784  -1.655  0.09794 .
educationlow         0.40429    0.21393   1.890  0.05877 .
gendermale          -0.04384    0.21348  -0.205  0.83729
ethnicityimmigrant   0.48796    0.29112   1.676  0.09371 .
brushing< 2          0.26244    0.26812   0.979  0.32766
breakfast< 7         1.25730    0.47601   2.641  0.00826 **
fooddrink> 7         0.98360    0.45653   2.155  0.03120 *
corah>= 13          16.14670  865.49661   0.019  0.98512
---
Signif. codes:  0 '***' 0.001 '**' 0.01 '*' 0.05 '.' 0.1 ' ' 1

Theta: count = 1.6689
Number of iterations in BFGS optimization: 17
Log-likelihood: -838.2 on 17 Df 2.5 % 97.5 %
count_(Intercept) 2.8176305 4.710609
count_educationlow 1.0516938 1.747675
count_gendermale 0.8232799 1.342851
count_ethnicityimmigrant 1.0410117 1.879962
count_brushing< 2 1.1019136 1.931618
count_breakfast< 7 0.7983455 1.649344
count_fooddrink> 7 0.6261915 1.354050
count_corah>= 13 0.9530647 2.263966
zero_(Intercept) 0.4890990 1.062205
zero_educationlow 0.9851189 2.278641
zero_gendermale 0.6298696 1.454358
zero_ethnicityimmigrant 0.9206978 2.882191
zero_brushing< 2 0.7686977 2.198867
zero_breakfast< 7 1.3831085 8.937661
zero_fooddrink> 7 1.0928891 6.542907
zero_corah>= 13 0.0000000 Inf## Negative binomial zero-inflated model (Table 4)
summary(hnb)
Call:
hurdle(formula = dmfs ~ ., data = OralHealthNL, dist = "negbin")

Pearson residuals:
    Min      1Q  Median      3Q     Max
-1.0564 -0.6754 -0.4458  0.3831  4.2094

Count model coefficients (truncated negbin with log link):
                   Estimate Std. Error z value Pr(>|z|)
(Intercept)         1.29286    0.13110   9.861  < 2e-16 ***
educationlow        0.30434    0.12956   2.349  0.01883 *
gendermale          0.05017    0.12481   0.402  0.68772
ethnicityimmigrant  0.33572    0.15078   2.227  0.02598 *
brushing< 2         0.37770    0.14319   2.638  0.00835 **
breakfast< 7        0.13758    0.18510   0.743  0.45732
fooddrink> 7       -0.08250    0.19674  -0.419  0.67497
corah>= 13          0.38452    0.22072   1.742  0.08148 .
Log(theta)          0.51214    0.18669   2.743  0.00608 **
Zero hurdle model coefficients (binomial with logit link):
                    Estimate Std. Error z value Pr(>|z|)
(Intercept)         -0.32742    0.19784  -1.655  0.09794 .
educationlow         0.40429    0.21393   1.890  0.05877 .
gendermale          -0.04384    0.21348  -0.205  0.83729
ethnicityimmigrant   0.48796    0.29112   1.676  0.09371 .
brushing< 2          0.26244    0.26812   0.979  0.32766
breakfast< 7         1.25730    0.47601   2.641  0.00826 **
fooddrink> 7         0.98360    0.45653   2.155  0.03120 *
corah>= 13          16.14670  865.49661   0.019  0.98512
---
Signif. codes:  0 '***' 0.001 '**' 0.01 '*' 0.05 '.' 0.1 ' ' 1

Theta: count = 1.6689
Number of iterations in BFGS optimization: 17
Log-likelihood: -838.2 on 17 Df 2.5 % 97.5 %
count_(Intercept) 2.87728799 4.7399839
count_educationlow 1.05358981 1.7408558
count_gendermale 0.83032458 1.3392020
count_ethnicityimmigrant 1.03700891 1.8491811
count_brushing< 2 1.08222465 1.8760869
count_breakfast< 7 0.81383157 1.6536956
count_fooddrink> 7 0.63596745 1.3590801
count_corah>= 13 1.01247274 2.3333949
zero_(Intercept) 0.67229117 1.6908065
zero_educationlow 0.43459181 1.1554917
zero_gendermale 0.66228485 1.7408712
zero_ethnicityimmigrant 0.32595659 1.2220538
zero_brushing< 2 0.42567249 1.4411974
zero_breakfast< 7 0.06835275 0.8785863
zero_fooddrink> 7 0.08307571 1.0765754
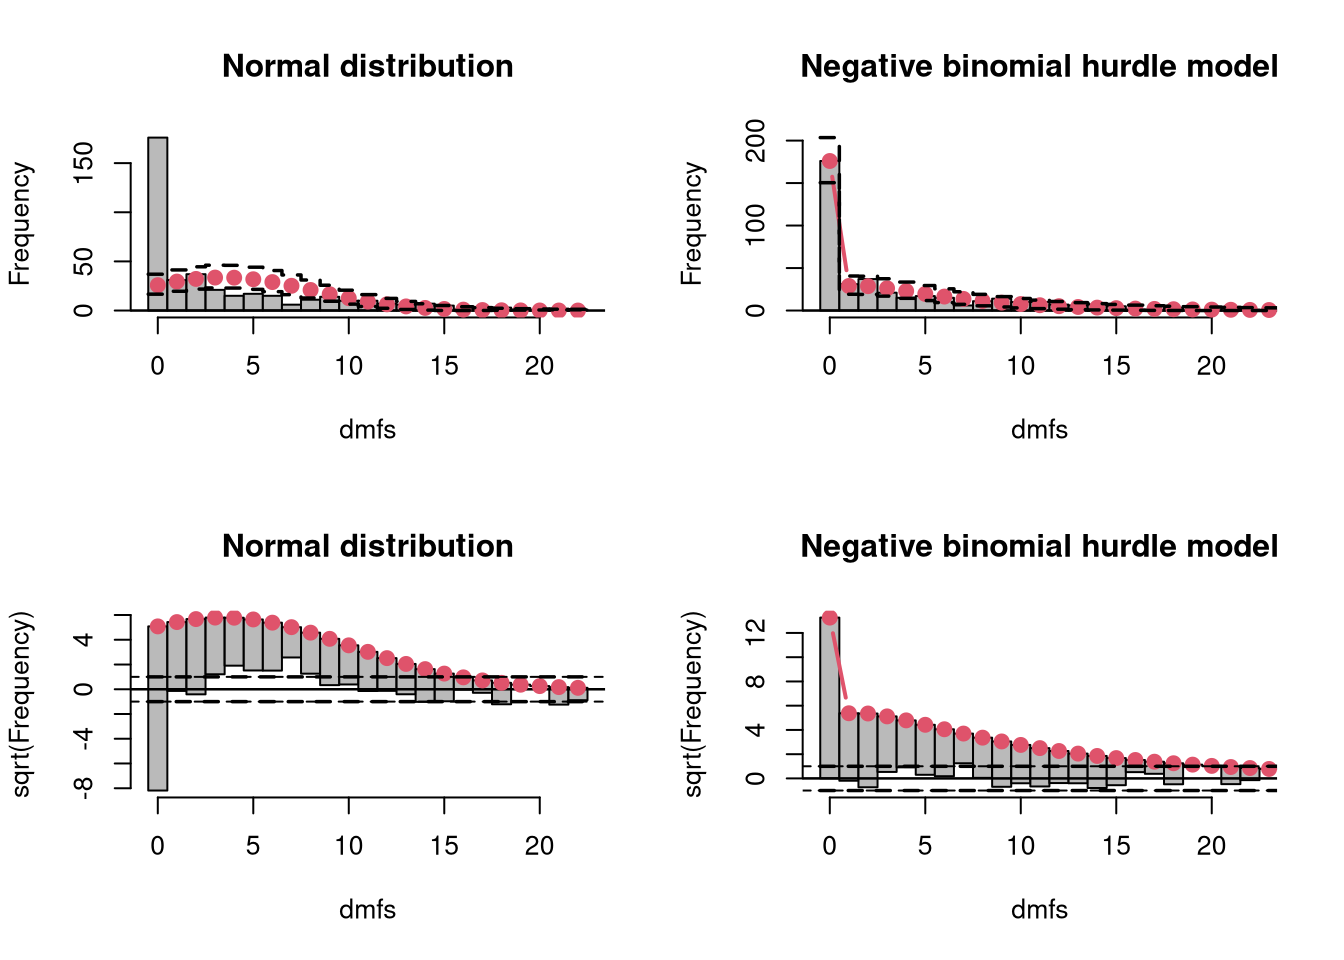
zero_corah>= 13 0.00000000 Inf## Rootograms (top left: Figure 1)
if(require("topmodels")) {
par(mfrow = c(2, 2))
rootogram(lm(OralHealthNL$dmfs ~ 1),
style = "standing", scale = "raw",
breaks = 0:23 - 0.5, xlim = c(-0.5, 22.5),
xlab = "dmfs", main = "Normal distribution")
rootogram(hnb,
style = "standing", scale = "raw",
width = 1, xlim = c(-0.5, 22.5),
xlab = "dmfs", main = "Negative binomial hurdle model")
rootogram(lm(OralHealthNL$dmfs ~ 1),
breaks = 0:23 - 0.5, xlim = c(-0.5, 22.5),
xlab = "dmfs", main = "Normal distribution")
abline(h = c(-1, 1), lty = 2)
rootogram(hnb,
width = 1, xlim = c(-0.5, 22.5),
xlab = "dmfs", main = "Negative binomial hurdle model")
abline(h = c(-1, 1), lty = 2)
par(mfrow = c(1, 1))
}
    dmfs     ZINB   Hurdle
176.0000 177.1231 176.0000 dmfs ZINB HNB
dmfs 1.0000000 0.348679 0.3490063
ZINB 0.3486790 1.000000 0.9997870
HNB 0.3490063 0.999787 1.0000000
z test of coefficients:

                   Estimate Std. Error z value Pr(>|z|)
(Intercept)           -0.32       0.20    -1.6     0.10
educationlow           0.40       0.21     1.9     0.06 .
gendermale            -0.04       0.21    -0.2     0.84
ethnicityimmigrant     0.47       0.29     1.6     0.10
brushing< 2            0.26       0.27     1.0     0.34
breakfast< 7           1.19       0.46     2.6     0.01 *
fooddrink> 7           0.93       0.45     2.1     0.04 *
corah>= 13             3.33       1.48     2.3     0.02 *
---
Signif. codes:  0 '***' 0.001 '**' 0.01 '*' 0.05 '.' 0.1 ' ' 1