Call:
lm(formula = qlogis(accuracy) ~ dyslexia * iq, data = ReadingSkills)

Residuals:
    Min      1Q  Median      3Q     Max
-2.6640 -0.3797  0.0369  0.4089  2.5035

Coefficients:
            Estimate Std. Error t value Pr(>|t|)
(Intercept)    1.601      0.226    7.09  1.4e-08 ***
dyslexia      -1.206      0.226   -5.34  4.0e-06 ***
iq             0.359      0.225    1.59    0.119
dyslexia:iq   -0.423      0.225   -1.88    0.068 .
---
Signif. codes:  0 '***' 0.001 '**' 0.01 '*' 0.05 '.' 0.1 ' ' 1

Residual standard error: 1.2 on 40 degrees of freedom
Multiple R-squared:  0.615, Adjusted R-squared:  0.586
F-statistic: 21.3 on 3 and 40 DF,  p-value: 2.08e-08
Call:
betareg(formula = accuracy ~ dyslexia * iq | dyslexia + iq, data = ReadingSkills,
    hessian = TRUE)

Quantile residuals:
   Min     1Q Median     3Q    Max
-2.362 -0.587  0.303  0.942  1.587

Coefficients (mean model with logit link):
            Estimate Std. Error z value Pr(>|z|)
(Intercept)    1.123      0.151    7.44  9.8e-14 ***
dyslexia      -0.742      0.151   -4.90  9.7e-07 ***
iq             0.486      0.167    2.91  0.00360 **
dyslexia:iq   -0.581      0.173   -3.37  0.00076 ***

Phi coefficients (precision model with log link):
            Estimate Std. Error z value Pr(>|z|)
(Intercept)    3.304      0.227   14.59  < 2e-16 ***
dyslexia       1.747      0.294    5.94  2.8e-09 ***
iq             1.229      0.460    2.67   0.0075 **
---
Signif. codes:  0 '***' 0.001 '**' 0.01 '*' 0.05 '.' 0.1 ' ' 1

Type of estimator: ML (maximum likelihood)
Log-likelihood: 65.9 on 7 Df
Pseudo R-squared: 0.576
Number of iterations in BFGS optimization: 25
Call:
betareg(formula = accuracy1 ~ dyslexia * iq | dyslexia + iq, data = ReadingSkills)

Randomized quantile residuals:
   Min     1Q Median     3Q    Max
-2.418 -0.598 -0.031  0.645  2.072

Coefficients (mu model with logit link):
            Estimate Std. Error z value Pr(>|z|)
(Intercept)    0.903      0.217    4.17  3.1e-05 ***
dyslexia      -0.606      0.182   -3.34  0.00084 ***
iq             0.329      0.188    1.75  0.07989 .
dyslexia:iq   -0.388      0.199   -1.94  0.05205 .

Phi coefficients (phi model with log link):
            Estimate Std. Error z value Pr(>|z|)
(Intercept)    3.499      0.530    6.60  4.1e-11 ***
dyslexia       1.736      0.449    3.86  0.00011 ***
iq             0.697      0.571    1.22  0.22243

Exceedence parameter (extended-support xbetax model):
        Estimate Std. Error z value Pr(>|z|)
Log(nu)   -1.790      0.854    -2.1    0.036 *
---
Signif. codes:  0 '***' 0.001 '**' 0.01 '*' 0.05 '.' 0.1 ' ' 1

Exceedence parameter nu: 0.167
Type of estimator: ML (maximum likelihood)
Log-likelihood: 18.5 on 8 Df
Number of iterations in BFGS optimization: 29 XBX Beta
(Intercept) 0.9030 1.1232
dyslexia -0.6065 -0.7416
iq 0.3288 0.4864
dyslexia:iq -0.3875 -0.5813
(phi)_(Intercept) 3.4990 3.3044
(phi)_dyslexia 1.7360 1.7466
(phi)_iq 0.6965 1.2291
Log(nu) -1.7905 NA## Visualization
plot(accuracy1 ~ iq, data = ReadingSkills, col = c(4, 2)[dyslexia], pch = 19)
nd <- data.frame(dyslexia = "no", iq = -30:30/10)
lines(nd$iq, predict(rs_xbx, nd), col = 4)
lines(nd$iq, predict(rs_beta, nd), col = 4, lty = 5)
lines(nd$iq, plogis(predict(rs_ols, nd)), col = 4, lty = 3)
nd <- data.frame(dyslexia = "yes", iq = -30:30/10)
lines(nd$iq, predict(rs_xbx, nd), col = 2)
lines(nd$iq, predict(rs_beta, nd), col = 2, lty = 5)
lines(nd$iq, plogis(predict(rs_ols, nd)), col = 2, lty = 3)
legend("topleft", c("Dyslexia: no", "Dyslexia: yes", "OLS", "XBX", "Beta"),
lty = c(0, 0, 3, 1, 5), pch = c(19, 19, NA, NA, NA), col = c(4, 2, 1, 1, 1), bty = "n")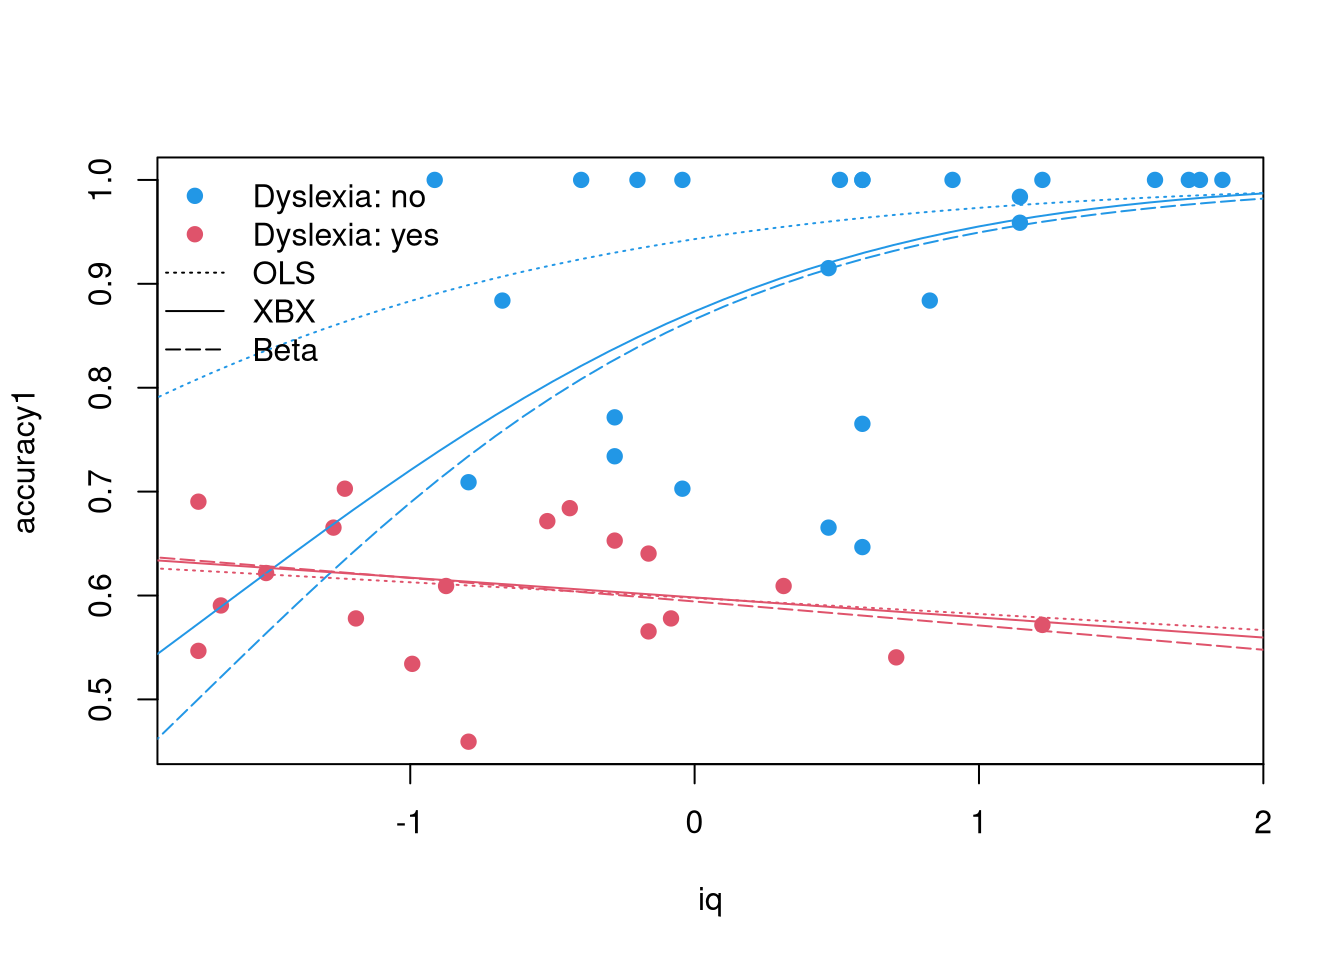
## see demo("SmithsonVerkuilen2006", package = "betareg") for further details