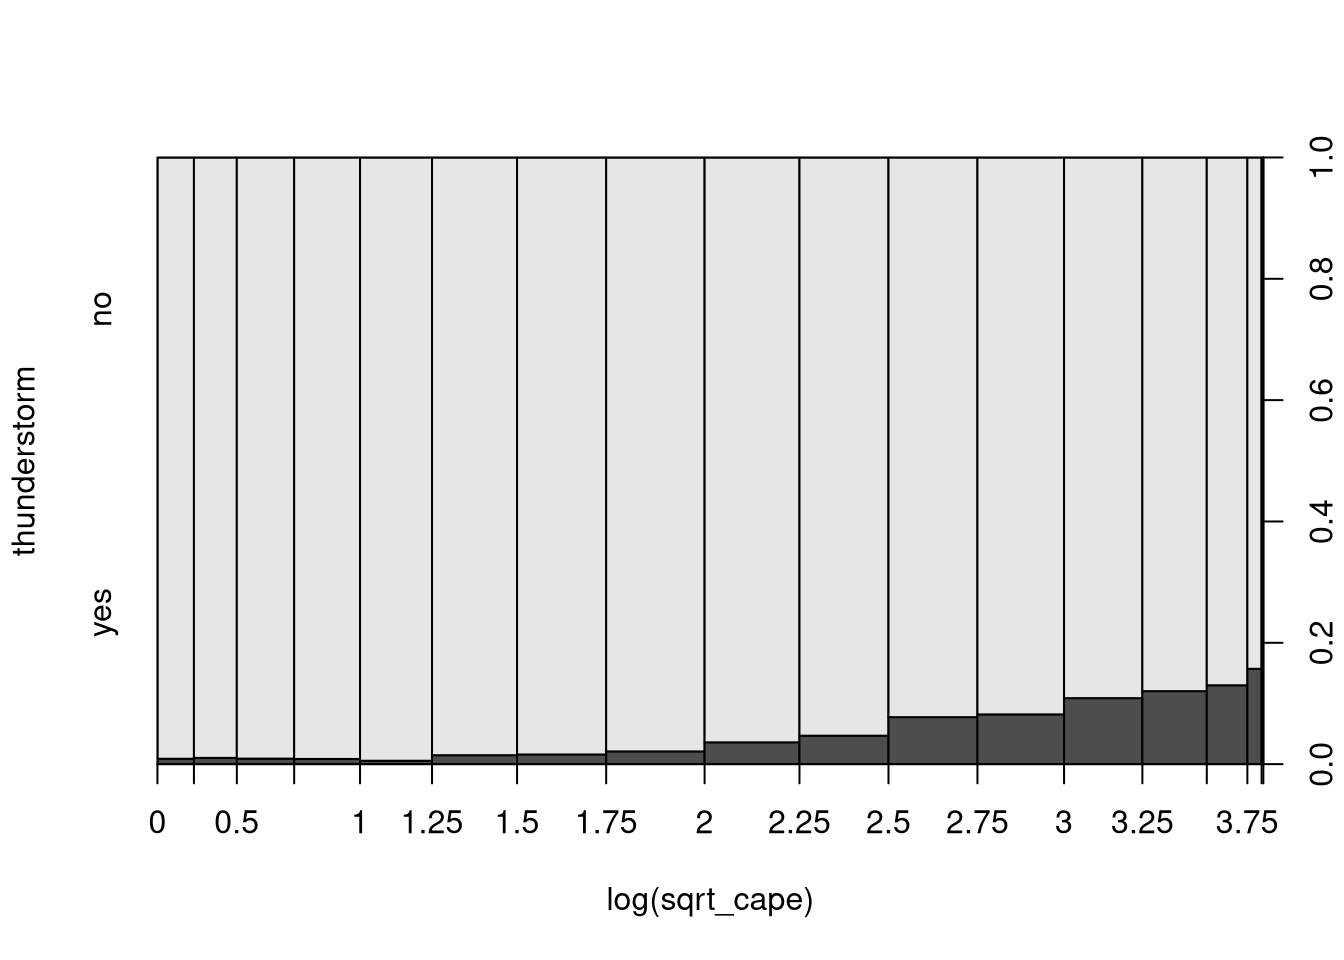
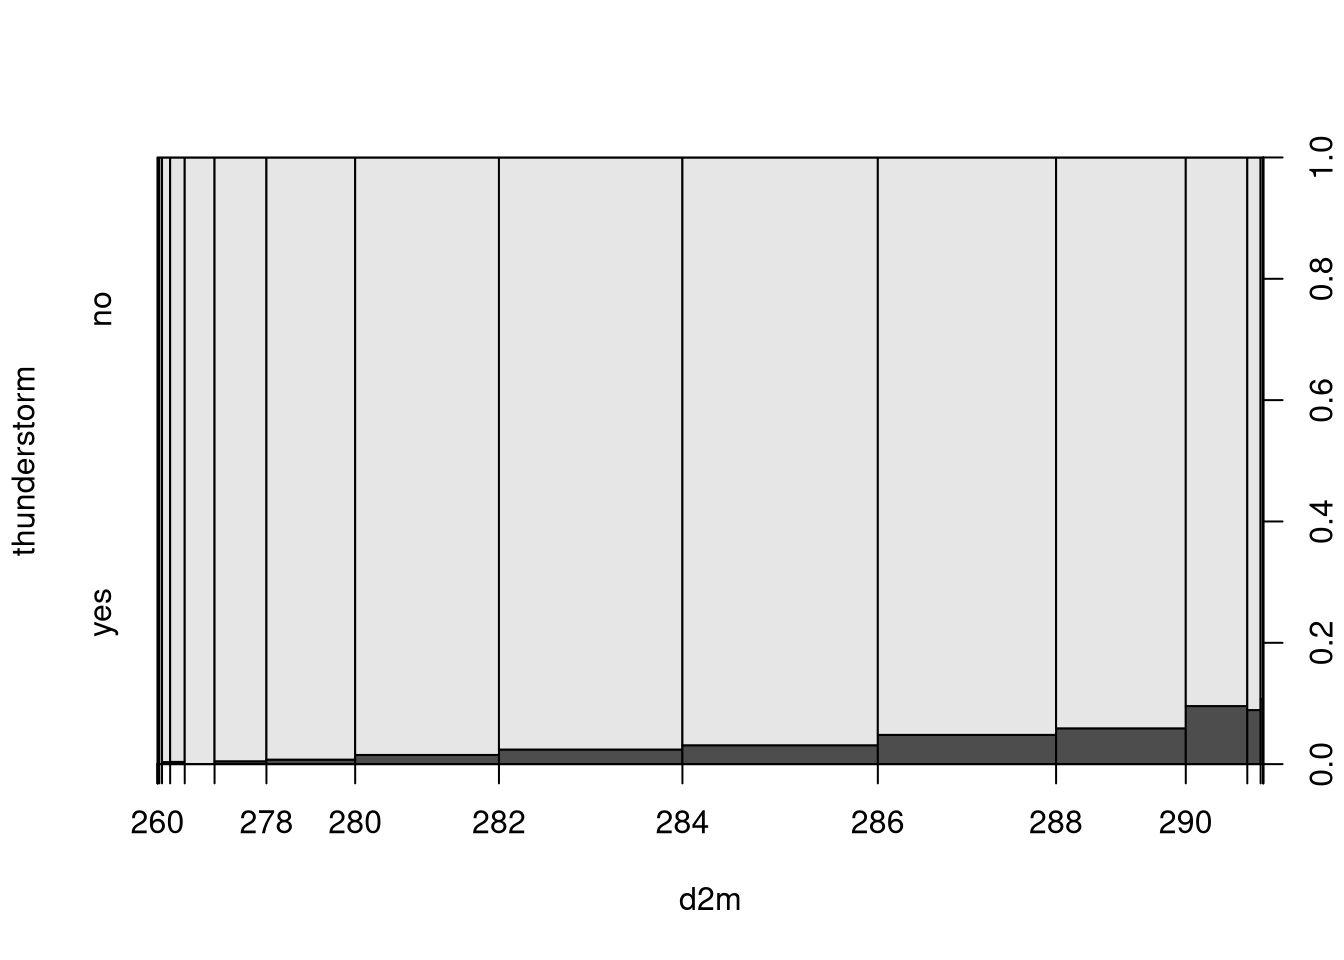
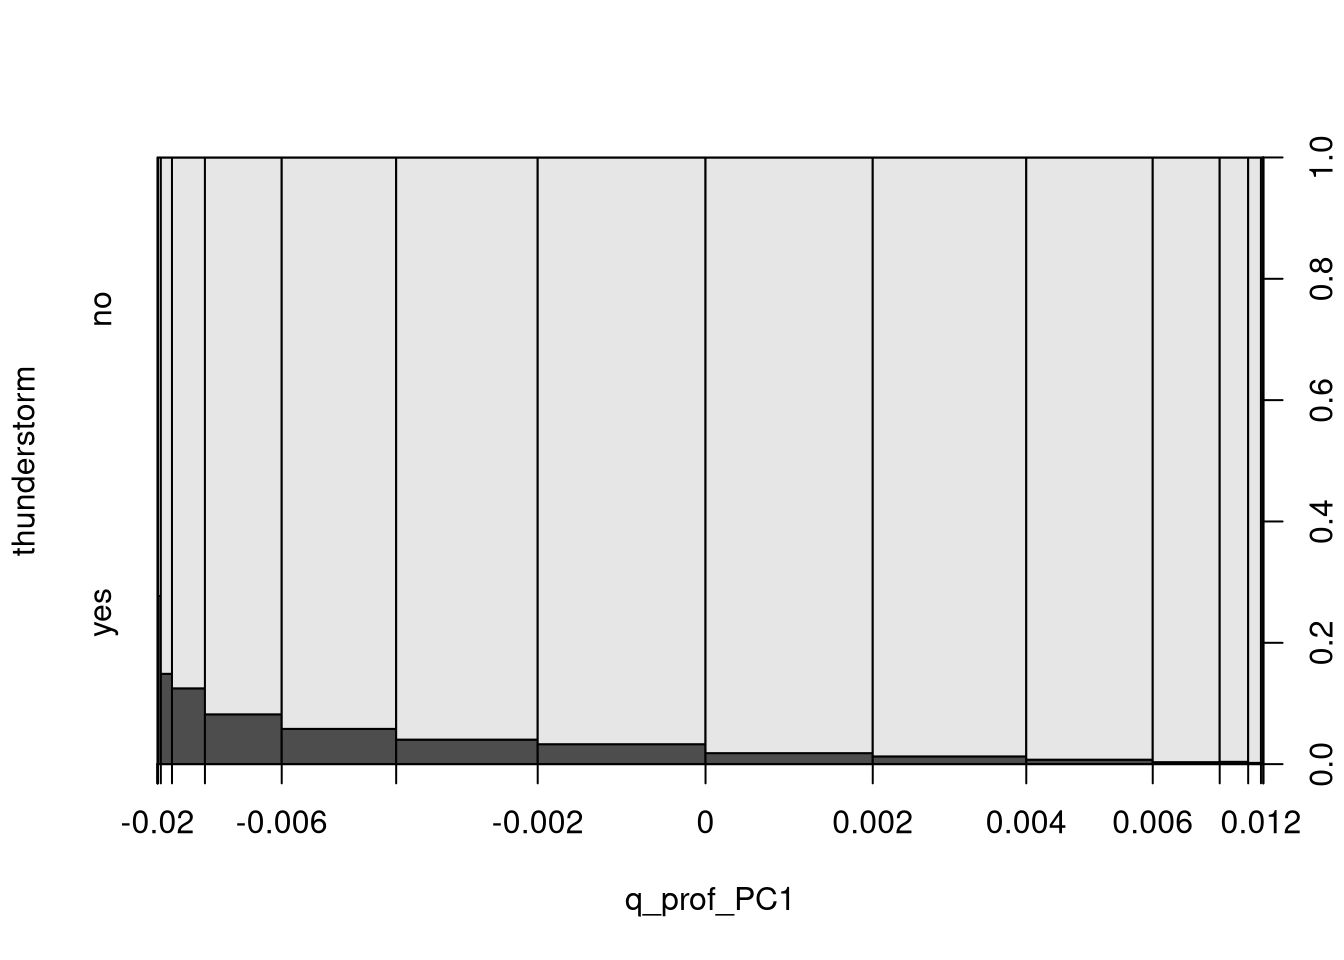
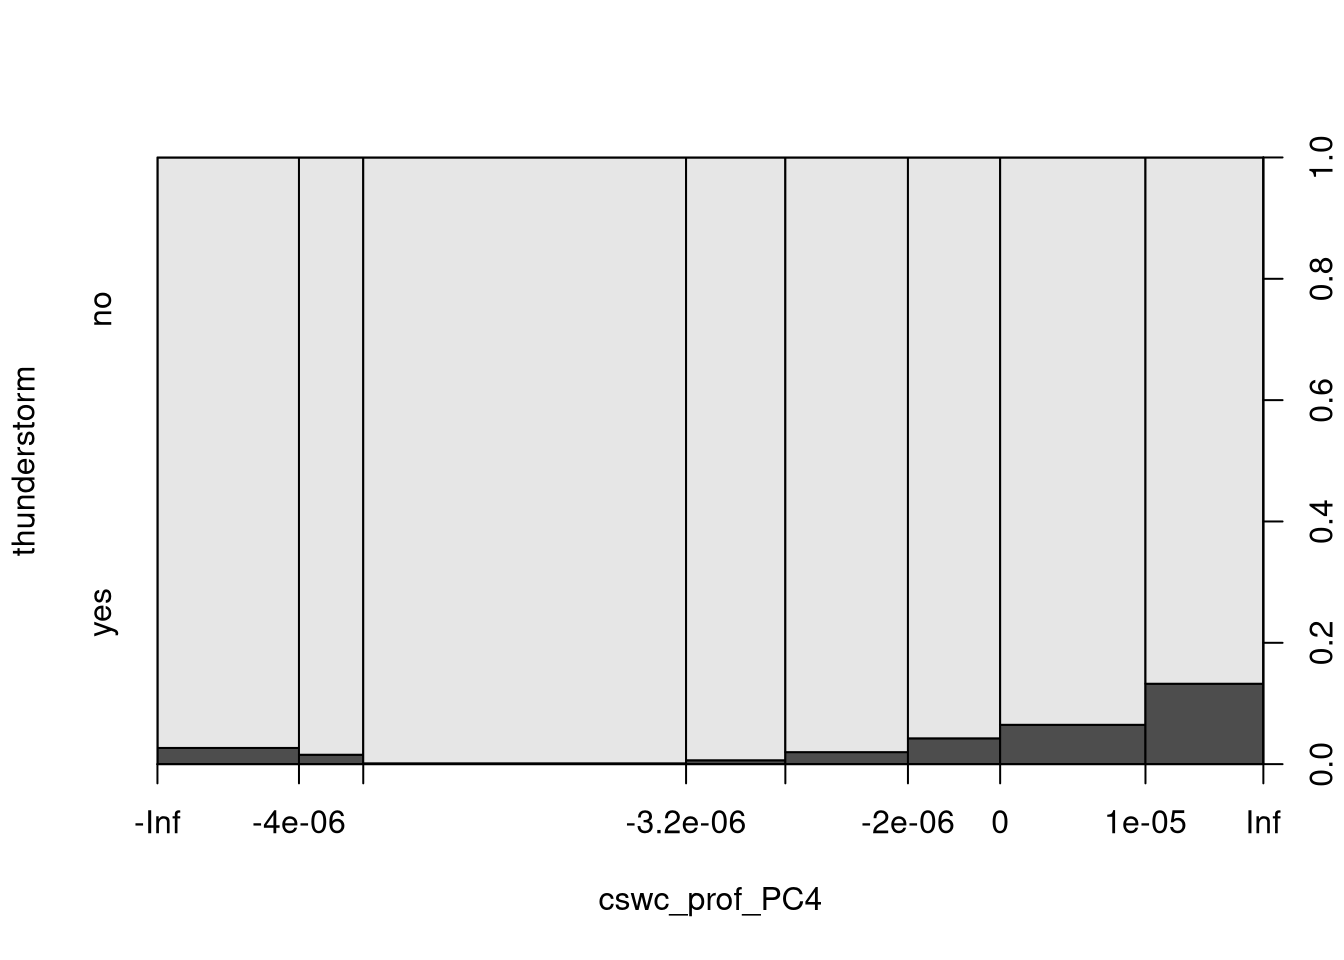
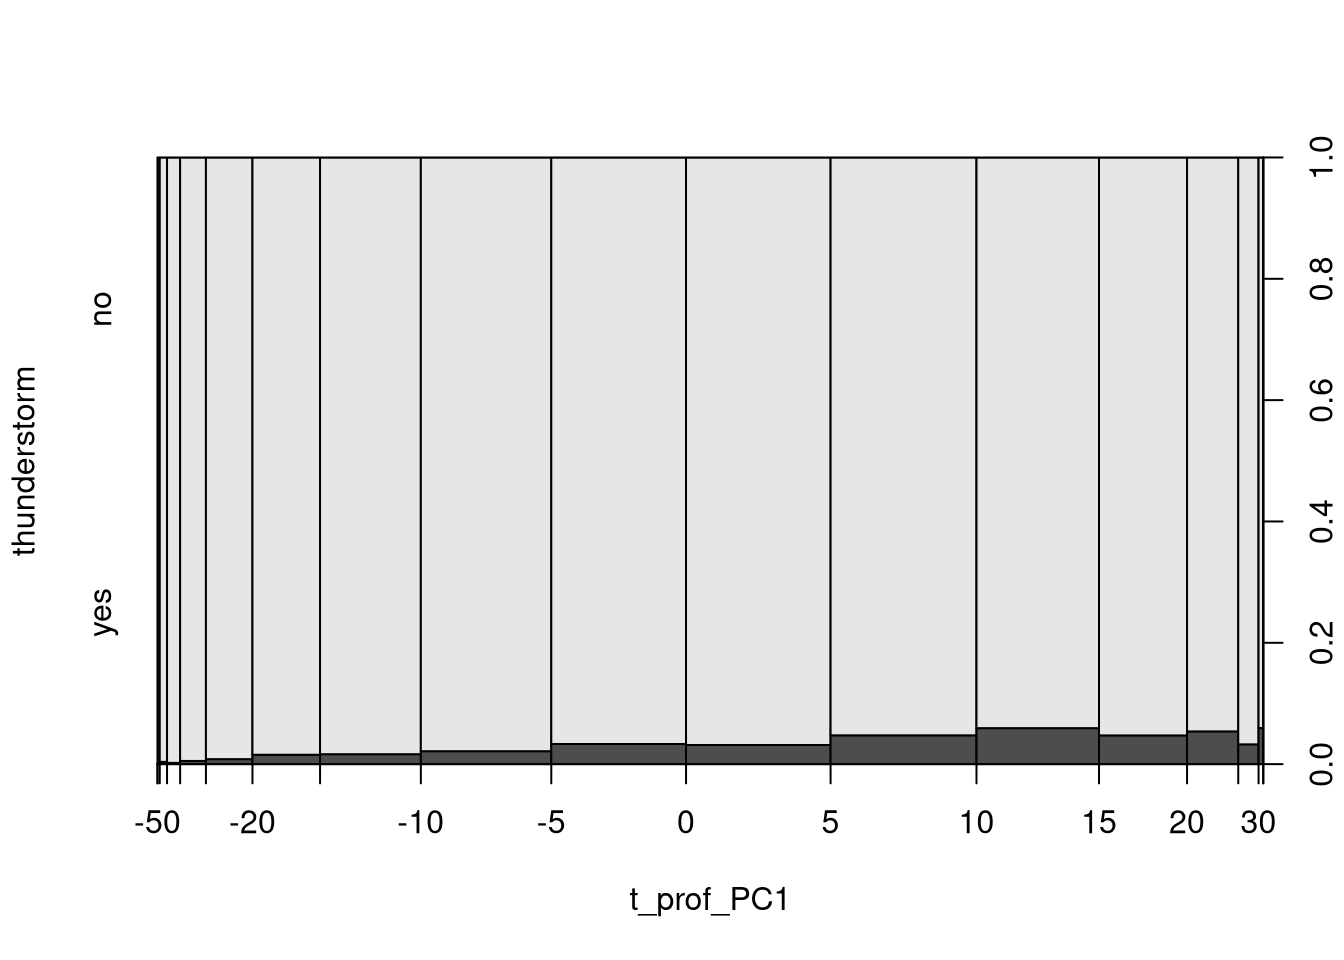
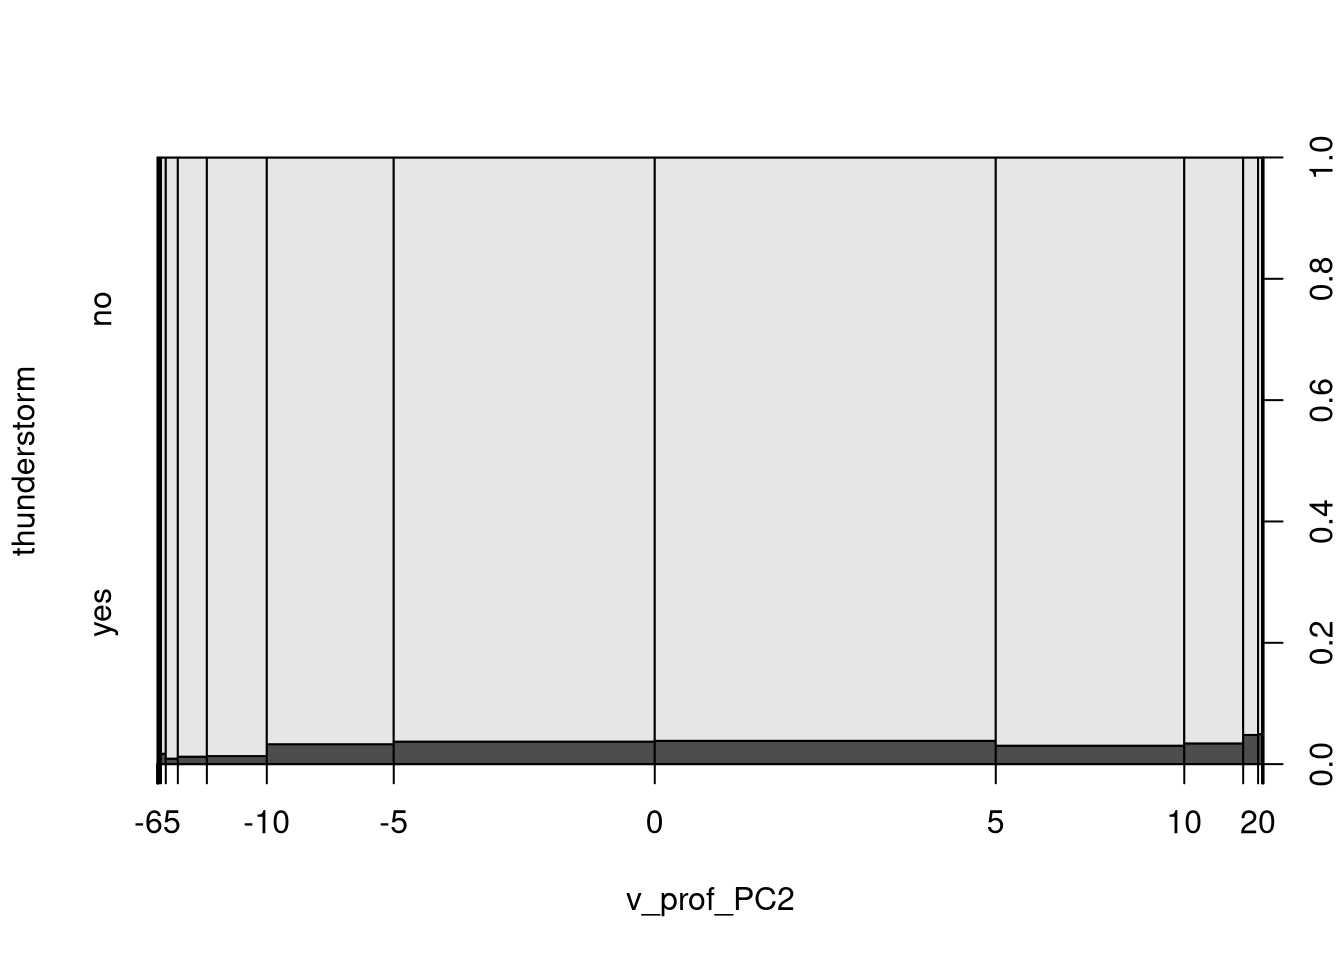
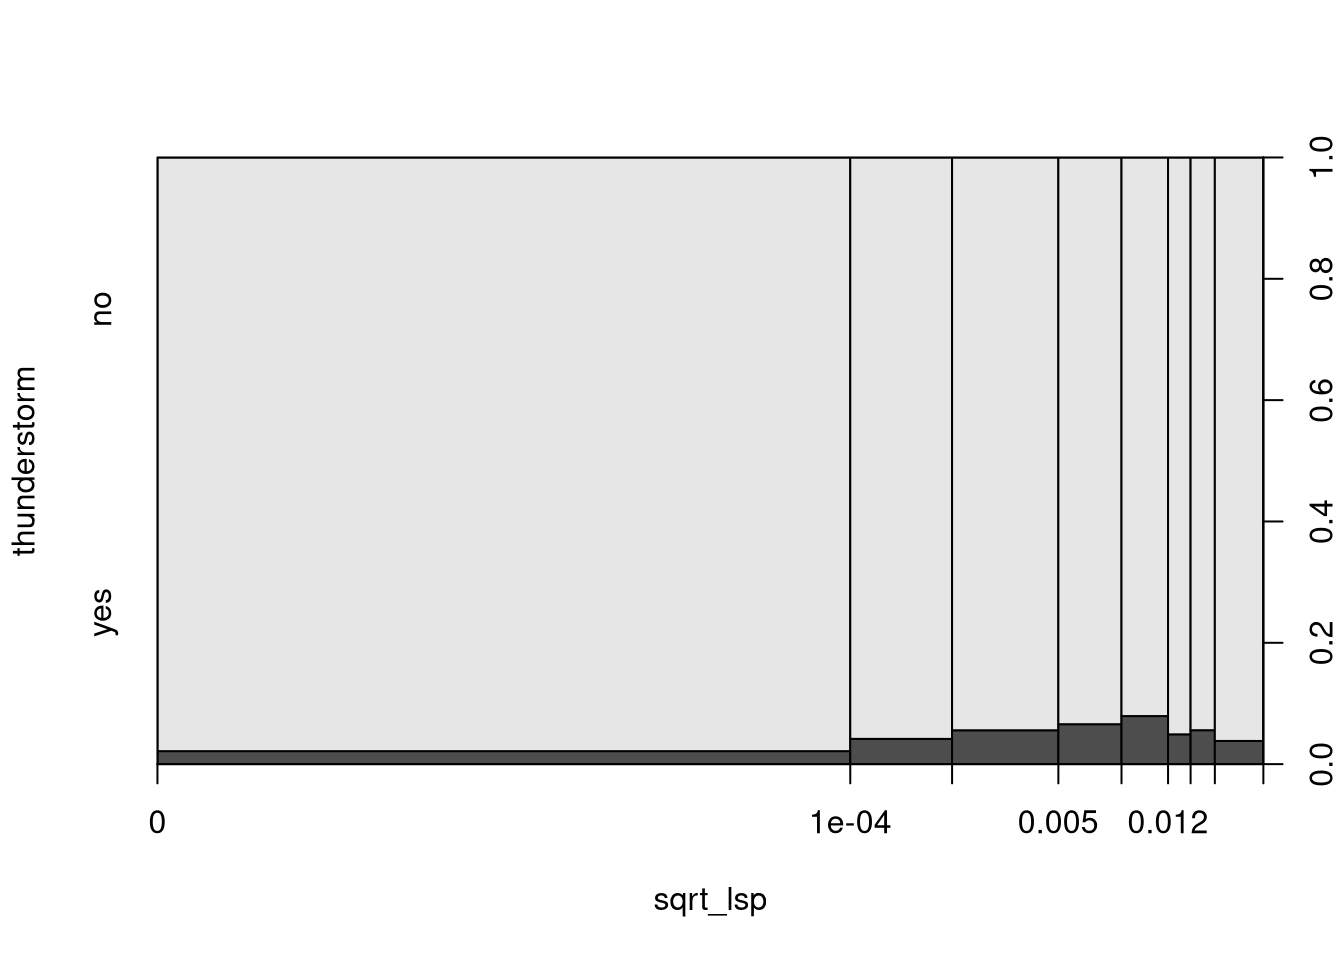
Thunderstorm occurrence on 32 x 32 sq-km grid over Austria, Europe, for the years 2010–2018 and the month May–August, derived by the ground-based Austrian Lightning Detection and Information System (ALDIS). A selection of atmospheric parameters from the fifth ECMWF re-analysis (ERA5) interpolated nearest neighbour method to the grid of the counted lightning discharges. The temporal resolution of the data is hourly.
Two objects ThunderstormAustriaTrain and ThunderstormAustriaEval are added to the environment, both of which are data.frames.
tunderstorm
factor indicating the occurrence of a tunderstorm.
d2m
2m dewpoint temperature.
q_prof_PC1
First principal component of the vertical profile of specific humidity.
cswc_prof_PC4
Fourth principal component of the vertical profile of specific snow water content.
t_prof_PC1
First principal component of the vertical profile of temperature.
v_prof_PC2
Second principal component of the vertical profile of v component of wind.
sqrt_cape
Square root of convective available potential energy.
sqrt_lsp
Square root of large scale precipitation.
Details
The World Meteorological Organization (WMO) defines a thunderstorm as follows: “One or more sudden electrical discharges, manifested by a flash of light (lightning) or rumbling sound (thunder).”
Following this definition the thunderstorm occurrence is derived from the ALDIS lightning detection data: If at least one lightning discharge was detected in a 32 x 32 sq-km grid, it indicates the occurrence of a thunderstorm. Only a random subset of the data given, thunderstorm occurrence is provided for training and evaluation: ThunderstormAustriaTrain and ThunderstormAustriaEval contain 40000 and 20000 observations, respectively.
References
To cite the flash count data (observations), please use:
Schulz W, Cummins K, Diendorfer G, Dorninger M (2005). Cloud-to-Ground Lightning in Austria: A 10-Year Study Using Data from a Lightning Location System. Journal of Geophysical Research: Atmospheres, 110(D9), D09101. doi:10.1029/2004JD005332
Schulz W, Diendorfer G, Pedeboy S, Poelman DR (2016). The European Lightning Location System EUCLID – Part 1: Performance Analysis and Validation. Natural Hazards and Earth System Sciences, 16(2), 595–605. doi:10.5194/nhess-16-595-2016
To cite the reanalyses data (covariates), please use:
Copernicus Climate Change Service (C3S) (2017). ERA5: Fifth Generation of ECMWF Atmospheric Reanalyses of the Global Climate. Copernicus Climate Change Service Climate Data Store (CDS), date of access: June 2019. https://cds.climate.copernicus.eu/cdsapp#!/home