Flash Counts in Austria 2010–2018

Description

Lightning discharges counted on 32 x 32 sq-km grid over Austria, Europe, for the years 2010–2018 and the month May–August, detected by the ground-based Austrian Lightning Detection and Information System (ALDIS). A selection of atmospheric parameters from the fifth ECMWF re-analysis (ERA5) interpolated nearest neighbour method to the grid of the counted lightning discharges. The temporal resolution of the data is hourly.

Usage

data("FlashAustria", package = "FlashAustria")

Format

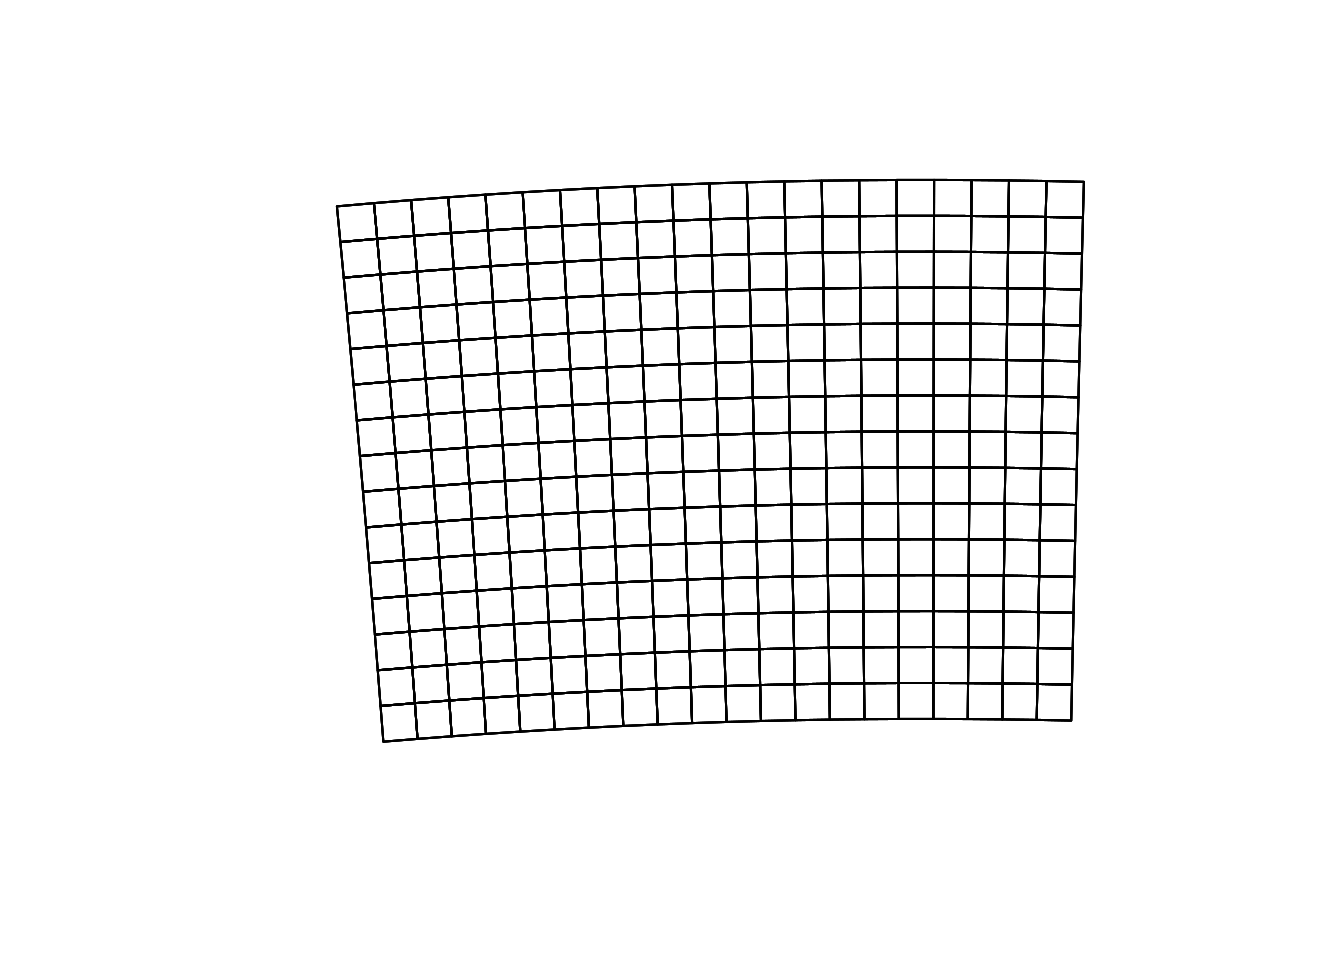
Three objects FlashAustriaTrain, FlashAustriaEval and FlashAustriaCase are added to the environment. FlashAustriaTrain and FlashAustriaEval are data.frames. FlashAustriaCase is an “sf” object, containing a geometry column providing the 32 x 32 sq-km grid as polygons.

counts
ALDIS counts of cloud-to-ground lightning discharges.
hcc
High cloud cover. The proportion of a grid box covered by cloud occurring in the high levels of the troposhere (approx. 6 km and above).
str
Surface net thermal radiation. Thermal radiation refers to radiation emitted by the atmoshere, clouds and the surface of the Earth. str is the difference between downward and upward thermal radiation at the surface of the Earth. The units are joules per square metre as the radiation is accumulated over a period of one hour.
tciw
Total column cloud ice water. The amount of ice contained within clouds in a column extending from the surface of the Earth to the top of the atmosphere.
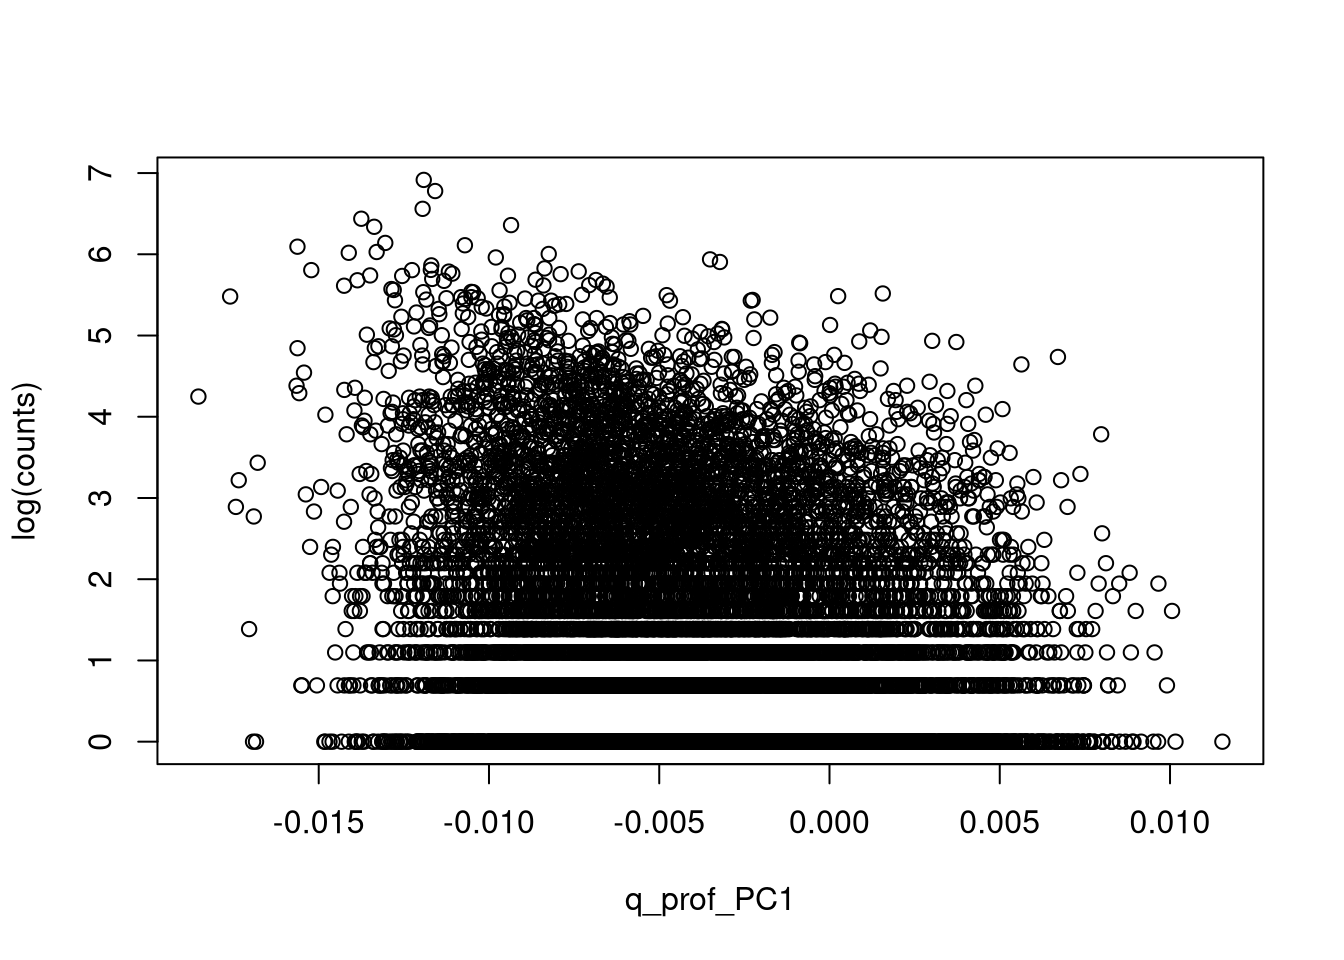
q_prof_PC1
This variable has been derived from the vertical profile of specific humidity (labelled q at the ECMWF) by principal component analysis. This is the first principal component.
sqrt_cape
The square root of convective available potential energy. This is an indication of the (in)stability of the atmosphere.

Details

Only a random subset of the data given positive counts is provided for training and evaluation: FlashAustriaTrain and FlashAustriaEval contain 12000 and 6000 observations, respectively. The following prediction cases are provided: 2019-09-15 06 UTC, 2001-09-15 17 UTC, 2001-09-15 23 UTC and 2001-09-16 13 UTC.

References

To cite the flash count data (observations), please use:

Schulz W, Cummins K, Diendorfer G, Dorninger M (2005). Cloud-to-Ground Lightning in Austria: A 10-Year Study Using Data from a Lightning Location System. Journal of Geophysical Research: Atmospheres, 110(D9), D09101. doi:10.1029/2004JD005332

Schulz W, Diendorfer G, Pedeboy S, Poelman DR (2016). The European Lightning Location System EUCLID – Part 1: Performance Analysis and Validation. Natural Hazards and Earth System Sciences, 16(2), 595–605. doi:10.5194/nhess-16-595-2016

To cite the reanalyses data (covariates), please use:

Copernicus Climate Change Service (C3S) (2017). ERA5: Fifth Generation of ECMWF Atmospheric Reanalyses of the Global Climate. Copernicus Climate Change Service Climate Data Store (CDS), date of access: June 2019. https://cds.climate.copernicus.eu/cdsapp#!/home
Examples

library("FlashAustria")

data("FlashAustria", package = "FlashAustria")
head(FlashAustriaTrain)
  counts      d2m   q_prof_PC1 cswc_prof_PC4 t_prof_PC1 v_prof_PC2 sqrt_cape
1      2 291.3184 -0.011472293  7.168725e-06  15.922548  2.5646172  45.37480
2     16 283.5004  0.001007288  1.612870e-05  -9.758380  0.7955608  14.62869
3      1 291.0506 -0.005590341 -3.226052e-06  20.274007  7.5535312  20.31514
4      7 288.0358 -0.006293043  3.715074e-05  14.258116  5.8523424  12.26630
5     41 288.4433 -0.006315605  3.509800e-05   8.757239  8.3675943  20.18042
6      1 286.6035 -0.001597900 -3.195042e-06  -3.433136 -3.4291366  10.63068
    sqrt_lsp
1 0.00000000
2 0.00350679
3 0.00000000
4 0.00000000
5 0.00000000
6 0.00000000
nrow(FlashAustriaTrain)
[1] 12000
nrow(FlashAustriaEval)
[1] 6000
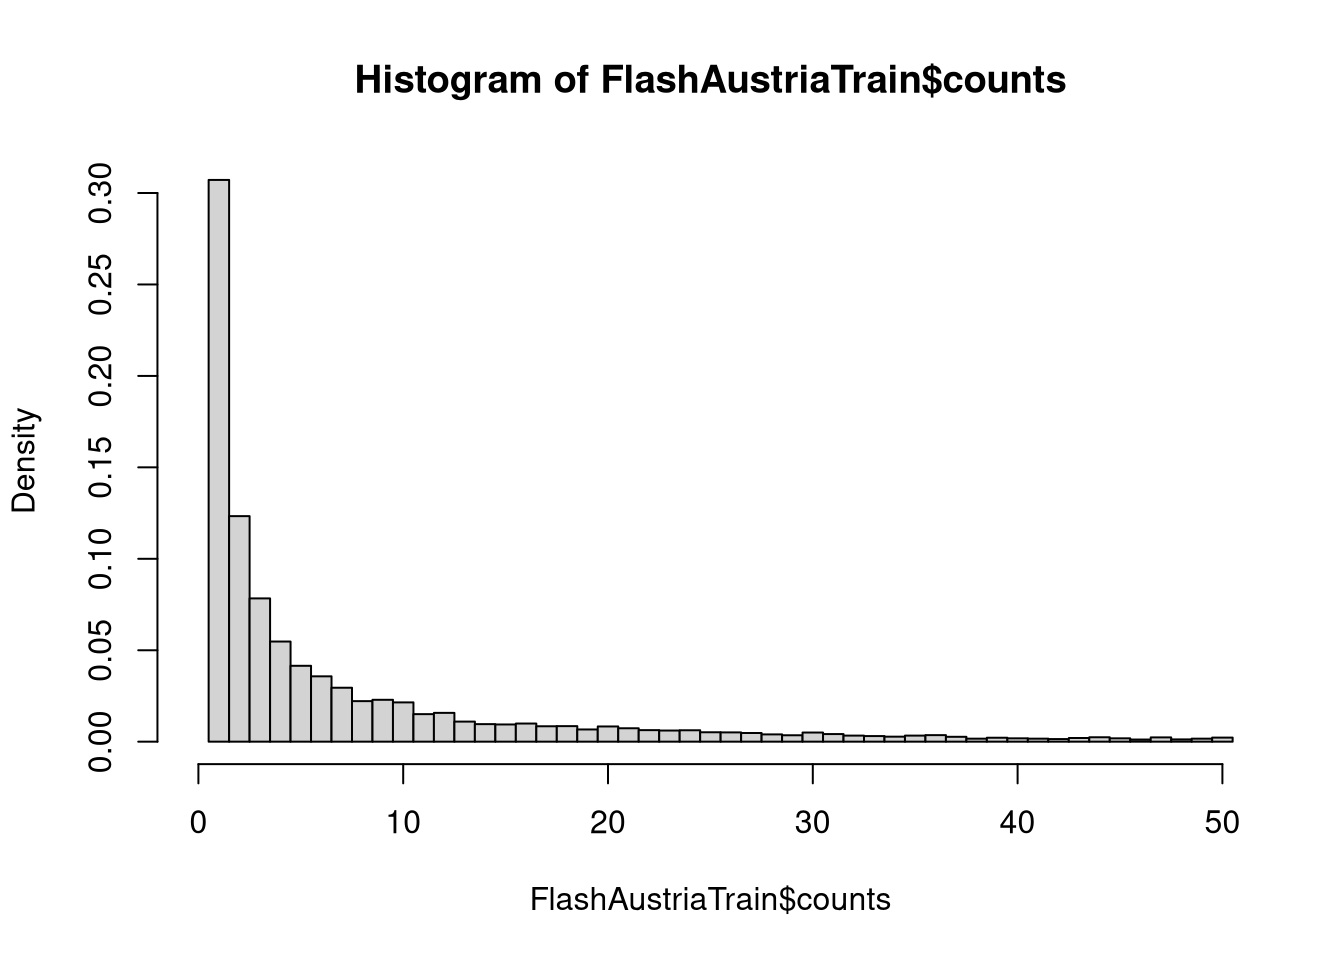
hist(FlashAustriaTrain$counts,
  breaks = c(seq(.5, 50.5), Inf),
  xlim = c(0, 50),
  col = "lightgray"
)

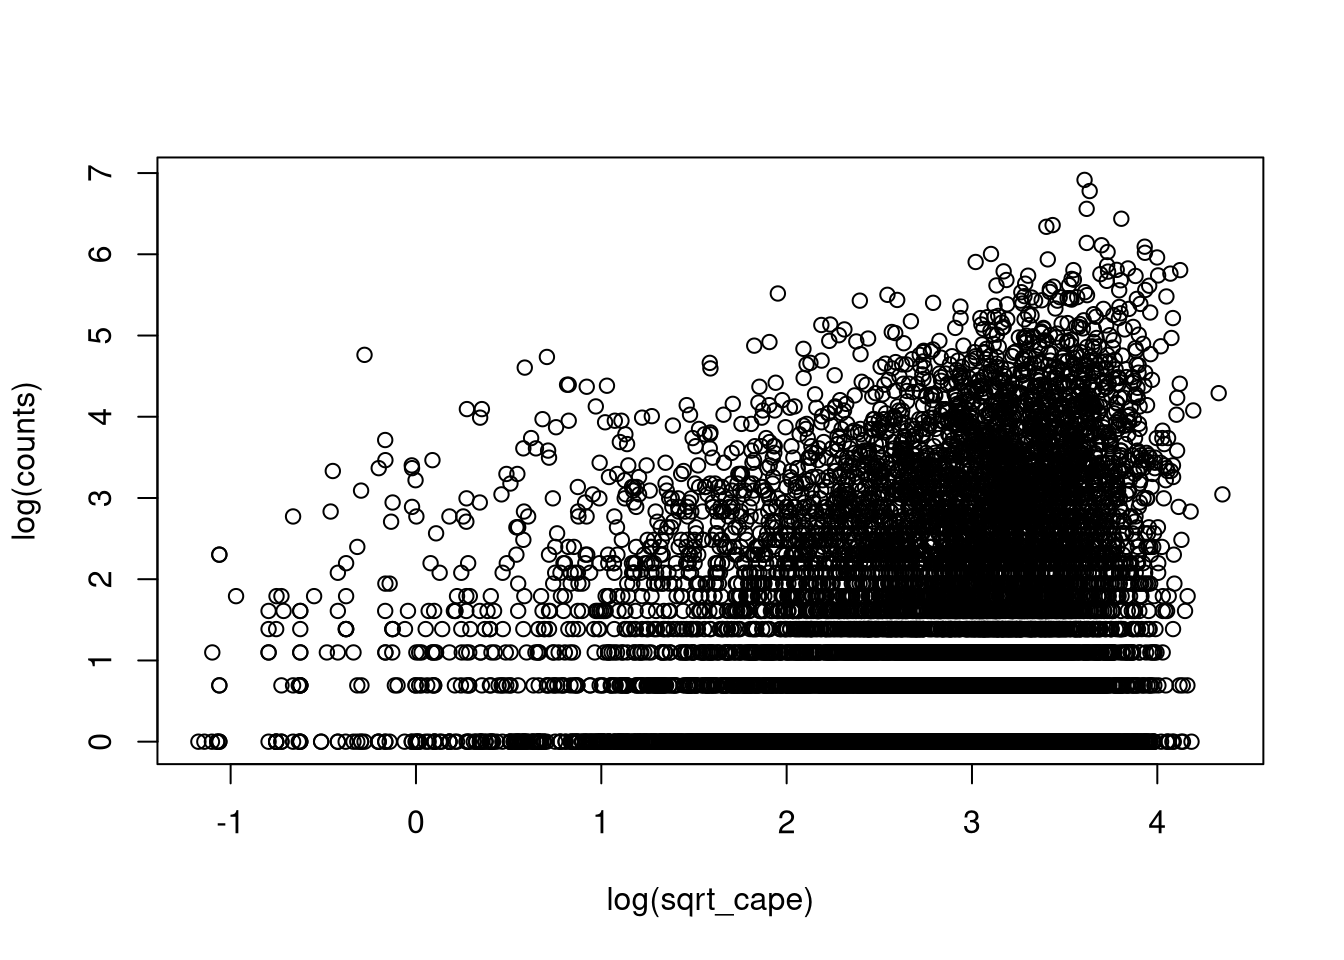
plot(log(counts) ~ log(sqrt_cape), FlashAustriaTrain)

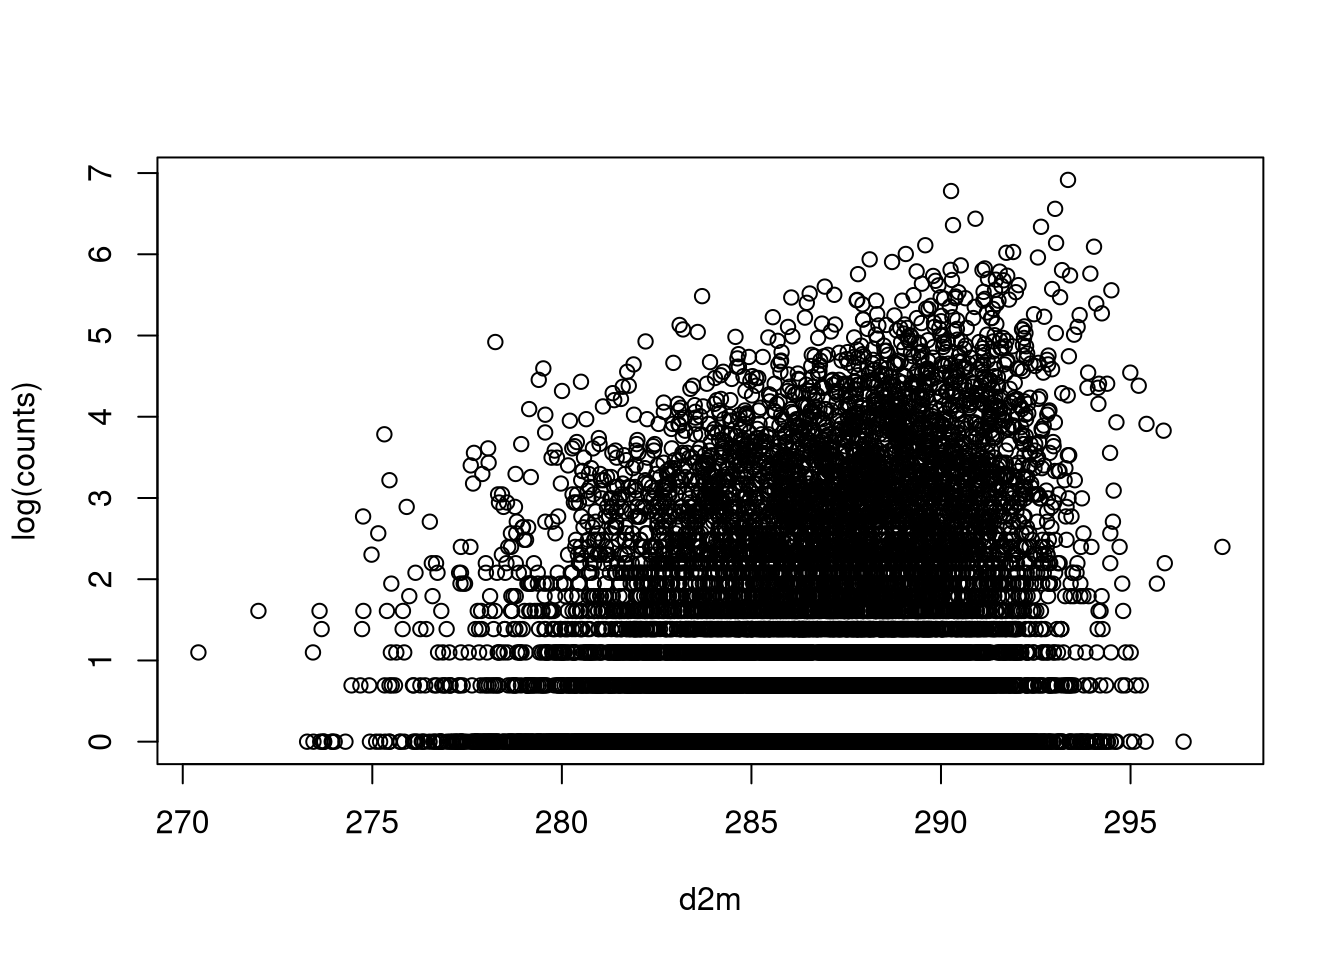
plot(log(counts) ~ d2m, FlashAustriaTrain)

plot(log(counts) ~ q_prof_PC1, FlashAustriaTrain)

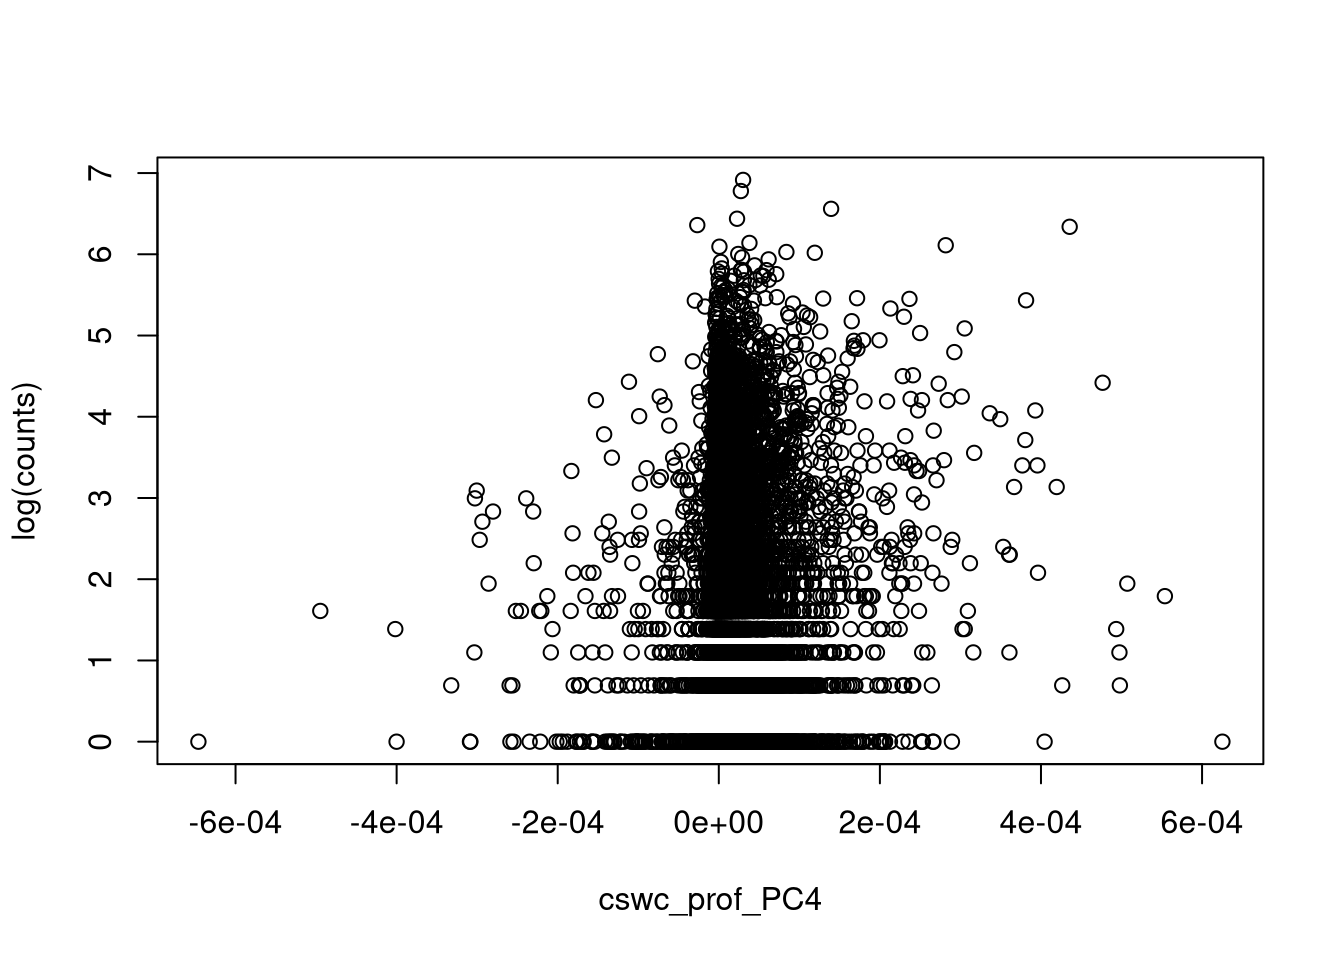
plot(log(counts) ~ cswc_prof_PC4, FlashAustriaTrain)

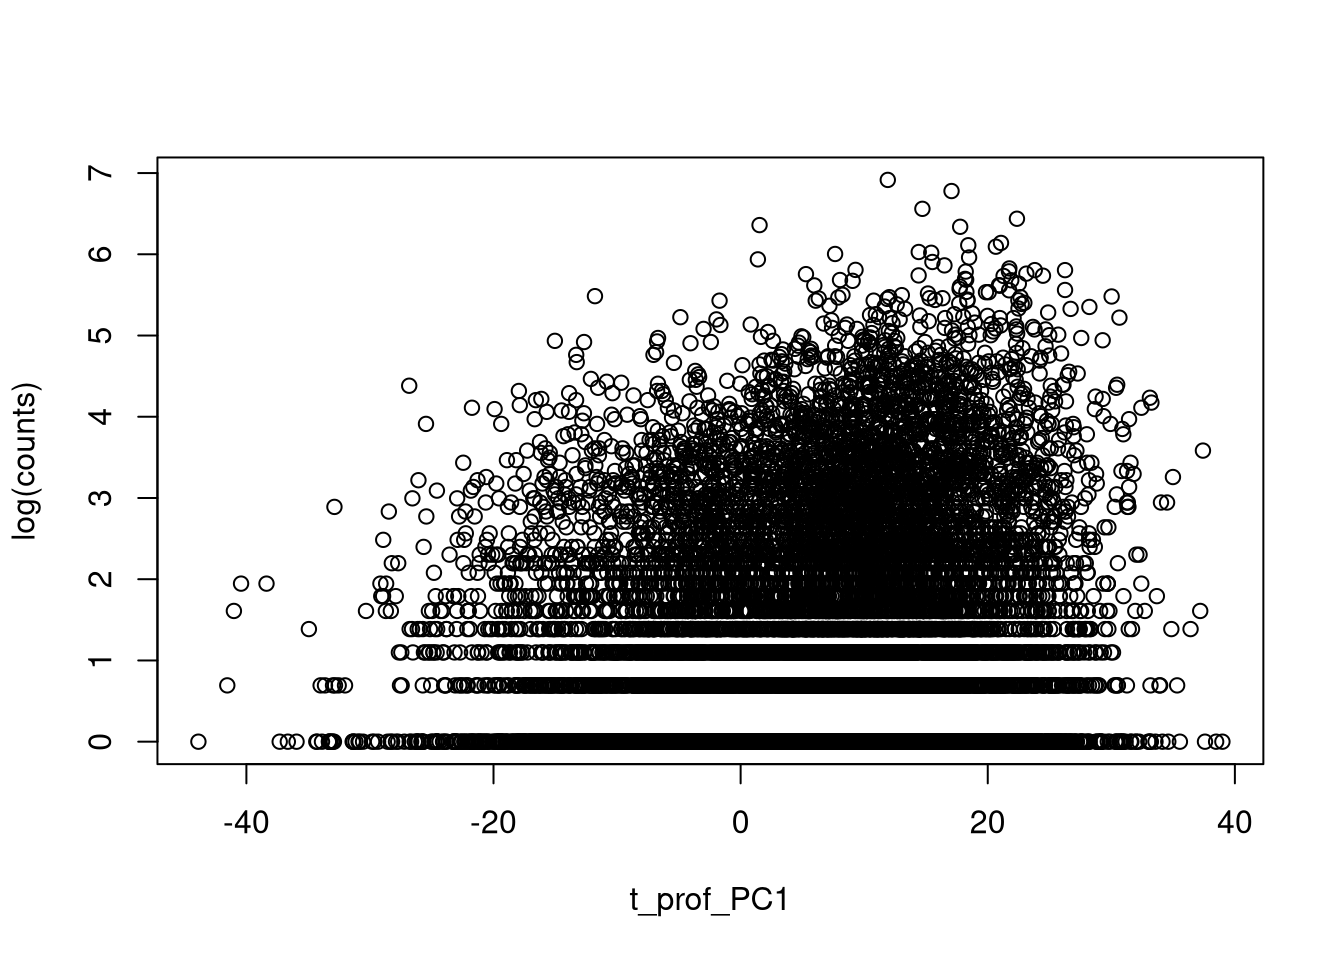
plot(log(counts) ~ t_prof_PC1, FlashAustriaTrain)

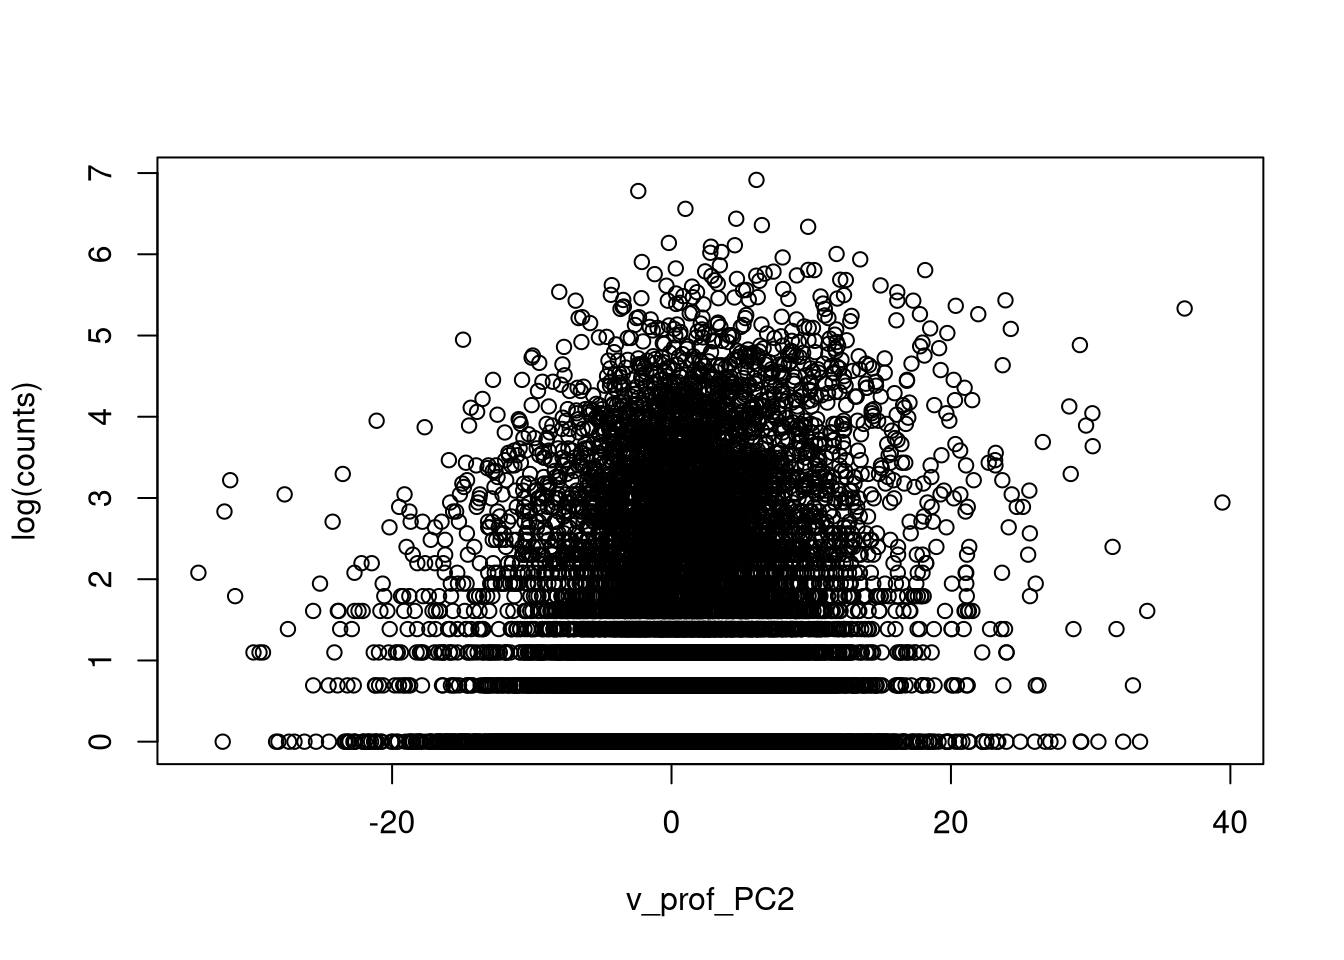
plot(log(counts) ~ v_prof_PC2, FlashAustriaTrain)

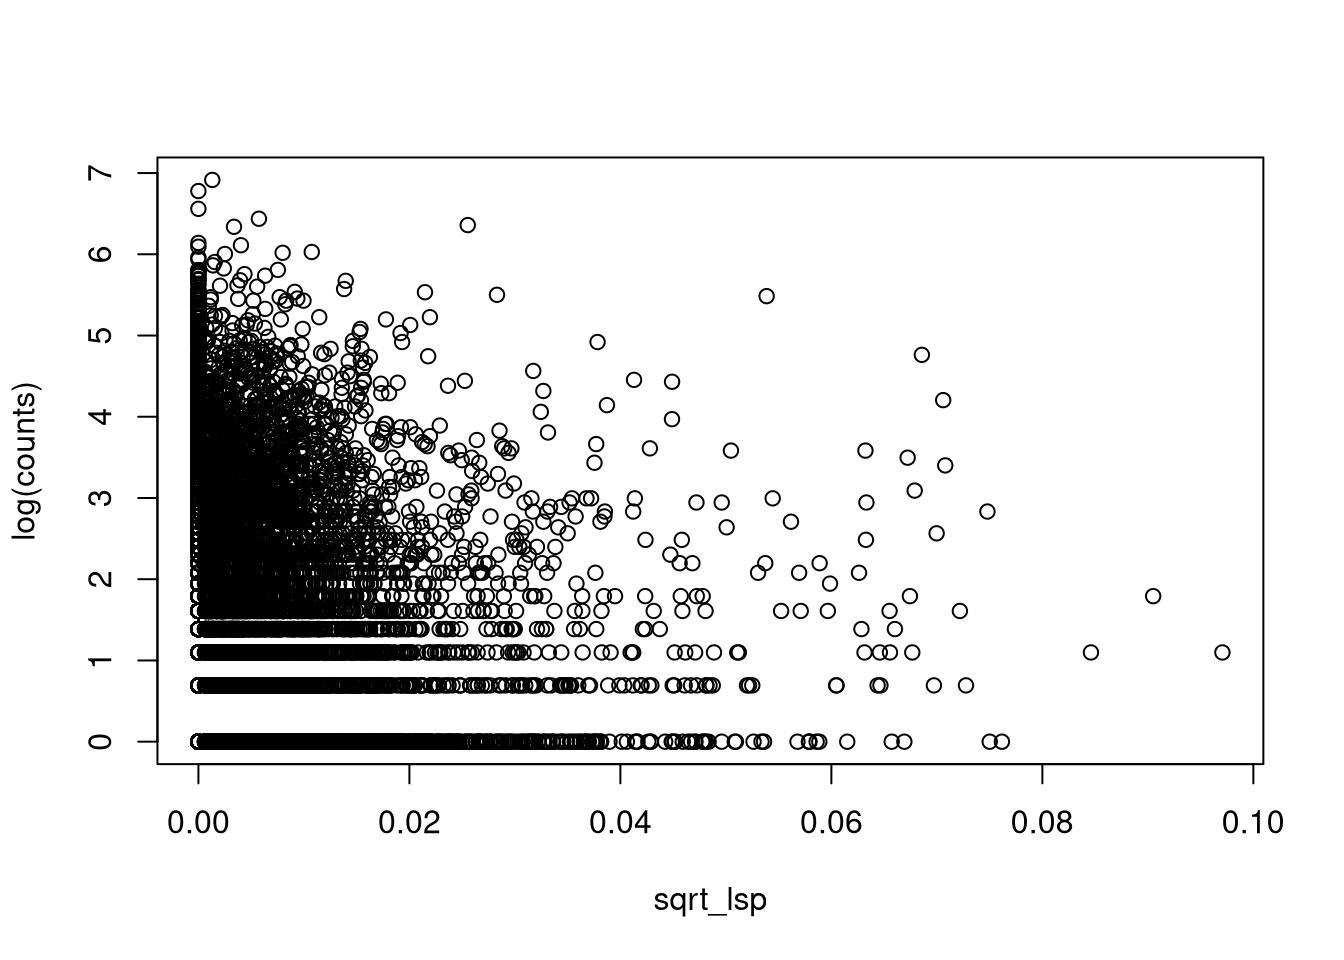
plot(log(counts) ~ sqrt_lsp, FlashAustriaTrain)

if(require("sf")) {
  class(FlashAustriaCase)
  head(FlashAustriaCase)
  plot(st_geometry(FlashAustriaCase))
}