install.packages("topmodels", repos = "https://zeileis.R-universe.dev")topmodels: A Toolbox for Probabilistic Regression Models
Forecasts, Visualizations, Scoring Rules, and Software Infrastructure
1 Overview
Probabilistic predictions have been receiving increasing interest in various application fields over the last decades due to necessary functional risk management and strategy. Consequently, there is an increasing demand for appropriate probabilistic models and corresponding evaluations of the goodness of fit. Besides proper probabilistic scores (Gneiting and Raftery 2007), which evaluate not only the expectation but the entire predictive distribution, graphical assessment methods are particularly advantageous to diagnose possible model misspecification problems.
Probabilistic predictions are often based on distributional regression models, for which a wide range of different packages is readily available: from basic models like lm() and glm() in base R (which can be interpreted as probabilistic models and not just mean regression models), over general packages for distributional regression like gamlss (Stasinopoulos and Rigby 2007) or bamlss Umlauf et al. (2021) to more specific packages for certain purposes. Examples for the latter include pscl or countreg (Zeileis et al. 2008) for count regression, crch (Messner et al. 2016) for certain censored regression models, or betareg (Cribari-Neto and Zeileis 2010) for beta regression, among many others. However, there is no unified and object-oriented approach available for all these different models/packages that allows to compute predictive distributions, probabilities, and quantiles. Therefore, routines to evaluate probabilistic models either graphically or via scoring rules are not always available or may be specific to certain packages. An easy-to-use unified infrastructure for graphically assessing and comparing different probabilistic models is not available, yet.
The topmodels package is designed to fill this gap and provide such an unifiying infrastructure to obtain predictions of probabilities, densities, etc. for probabilistic models. The unifying prediction infrastructure is the basis for numerous graphical evaluation tools, such as rootograms (Kleiber and Zeileis 2016), PIT histograms (Gneiting et al. 2007), reliagrams (reliability diagrams, Wilks 2011), randomized quantile Q-Q plots (Dunn and Smyth 1996), and worm plots (Buuren and Fredriks 2001).
To be able to use the object-oriented framework of topmodels, solely a prodist() method must exist for the model class of interest. Currently the package provides generic procast methods for the model classes lm, glm, crch (Messner et al. 2016), and disttree (Schlosser et al. 2019).
2 Installation
For the package topmodels so far only a development version is available, which is hosted on Codeberg at https://codeberg.org/zeileis/topmodels/ in a Git repository and can be easily installed from R-universe at https://zeileis.R-universe.dev/.
3 Usage
The package topmodels provides various routines to easily graphically assess and compare different probabilistic models and model types using ggplot2 (Wickham 2016) and base R graphics:
library("topmodels")
data("FIFA2018", package = "distributions3")
m <- glm(goals ~ difference, data = FIFA2018, family = poisson)rootogram(m)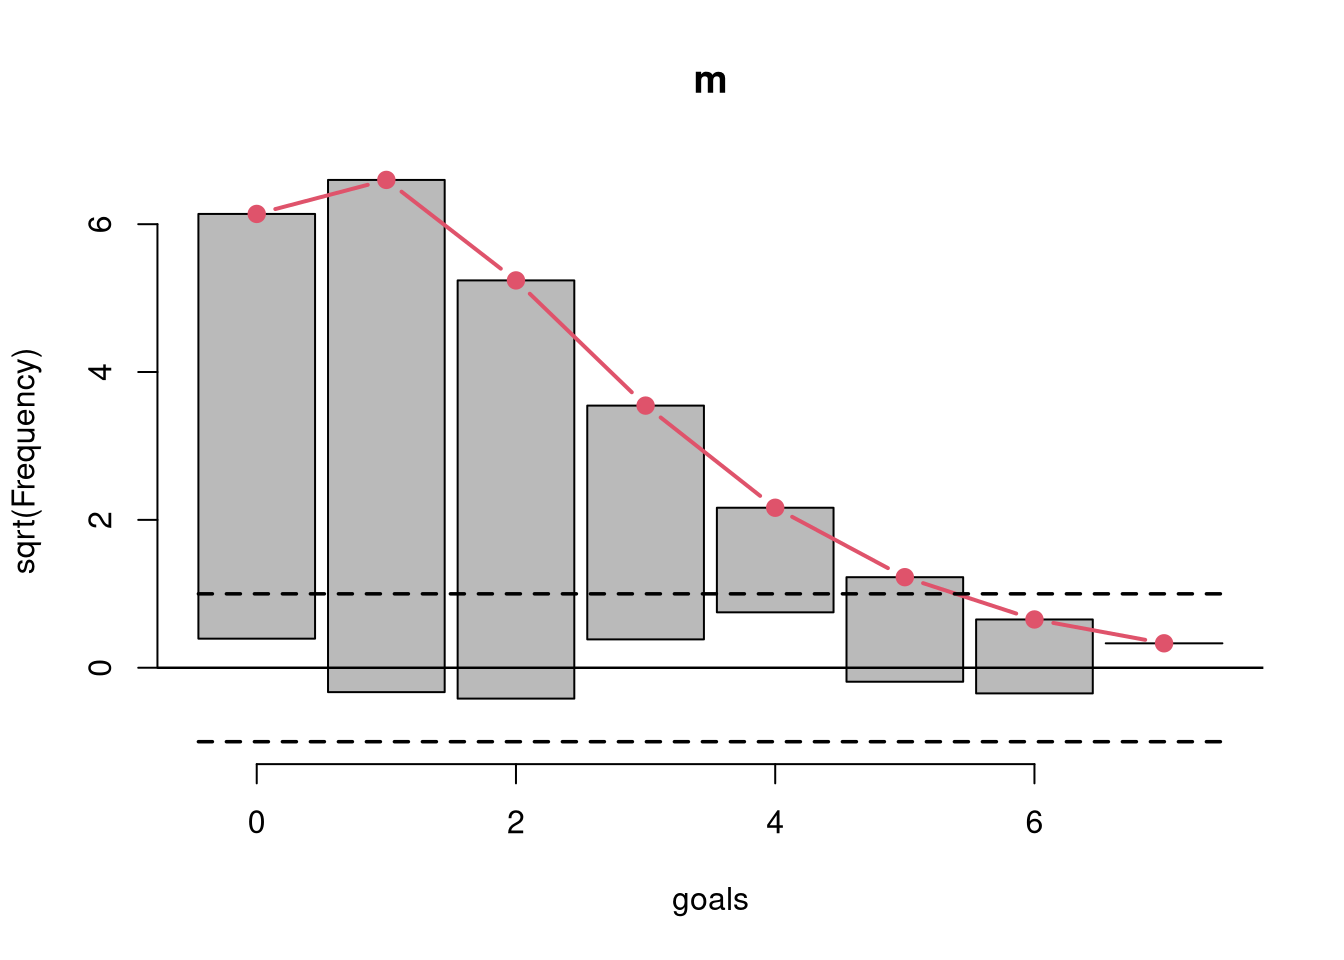
pithist(m)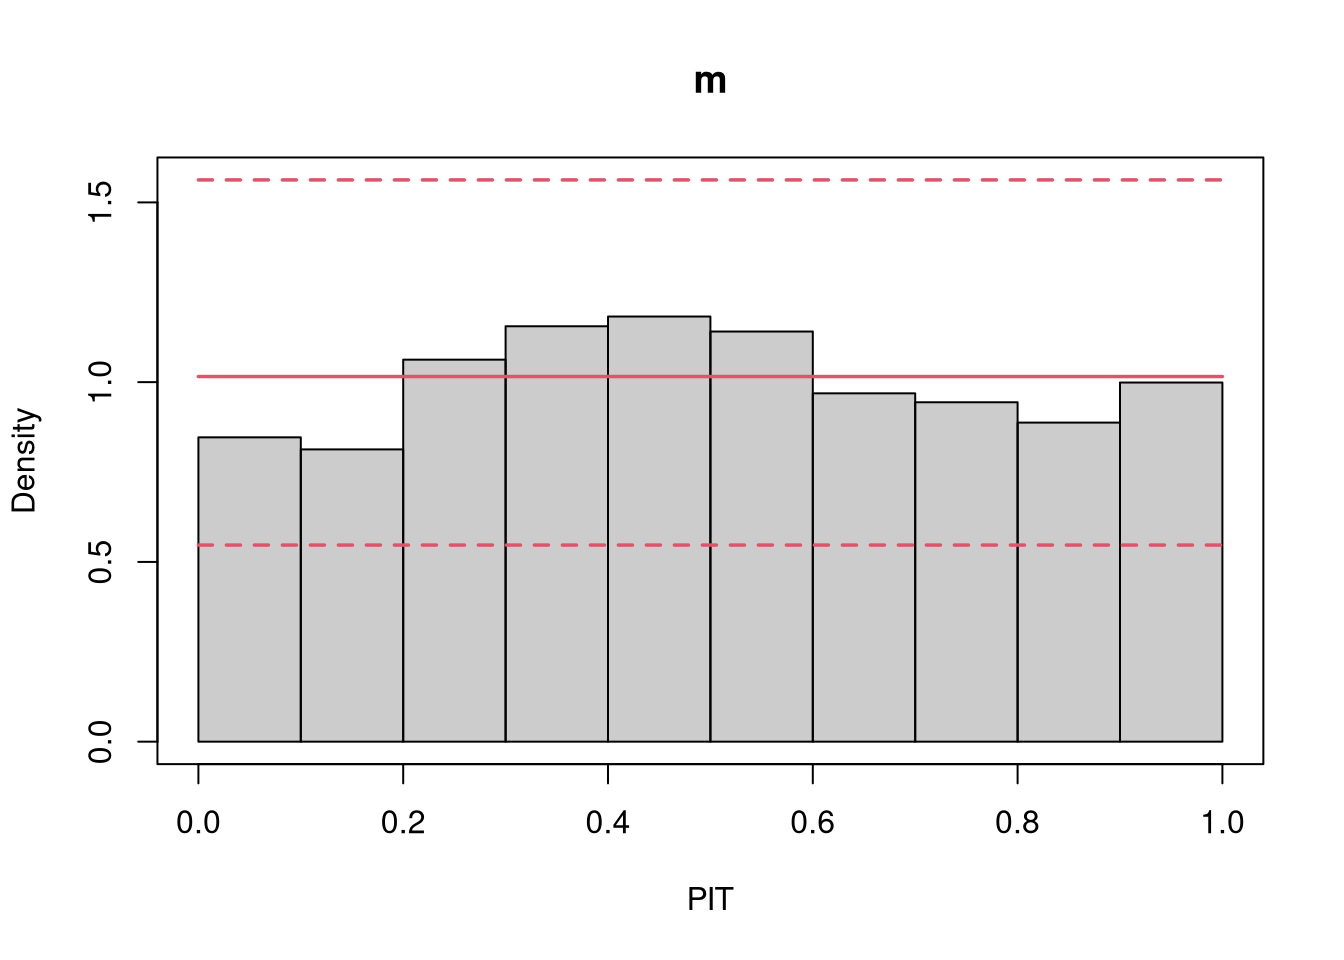
qqrplot(m)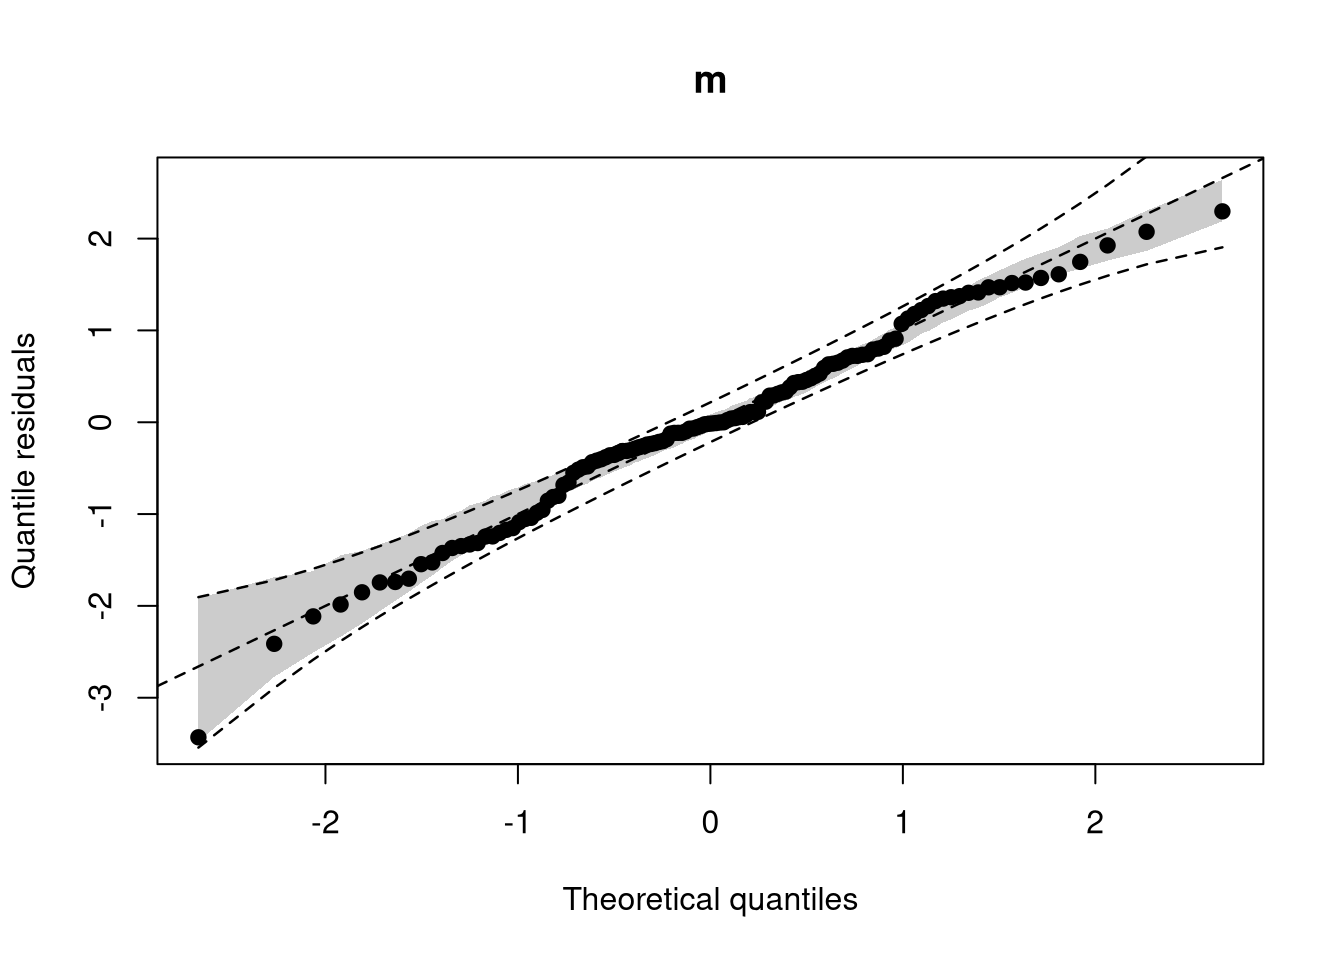
wormplot(m)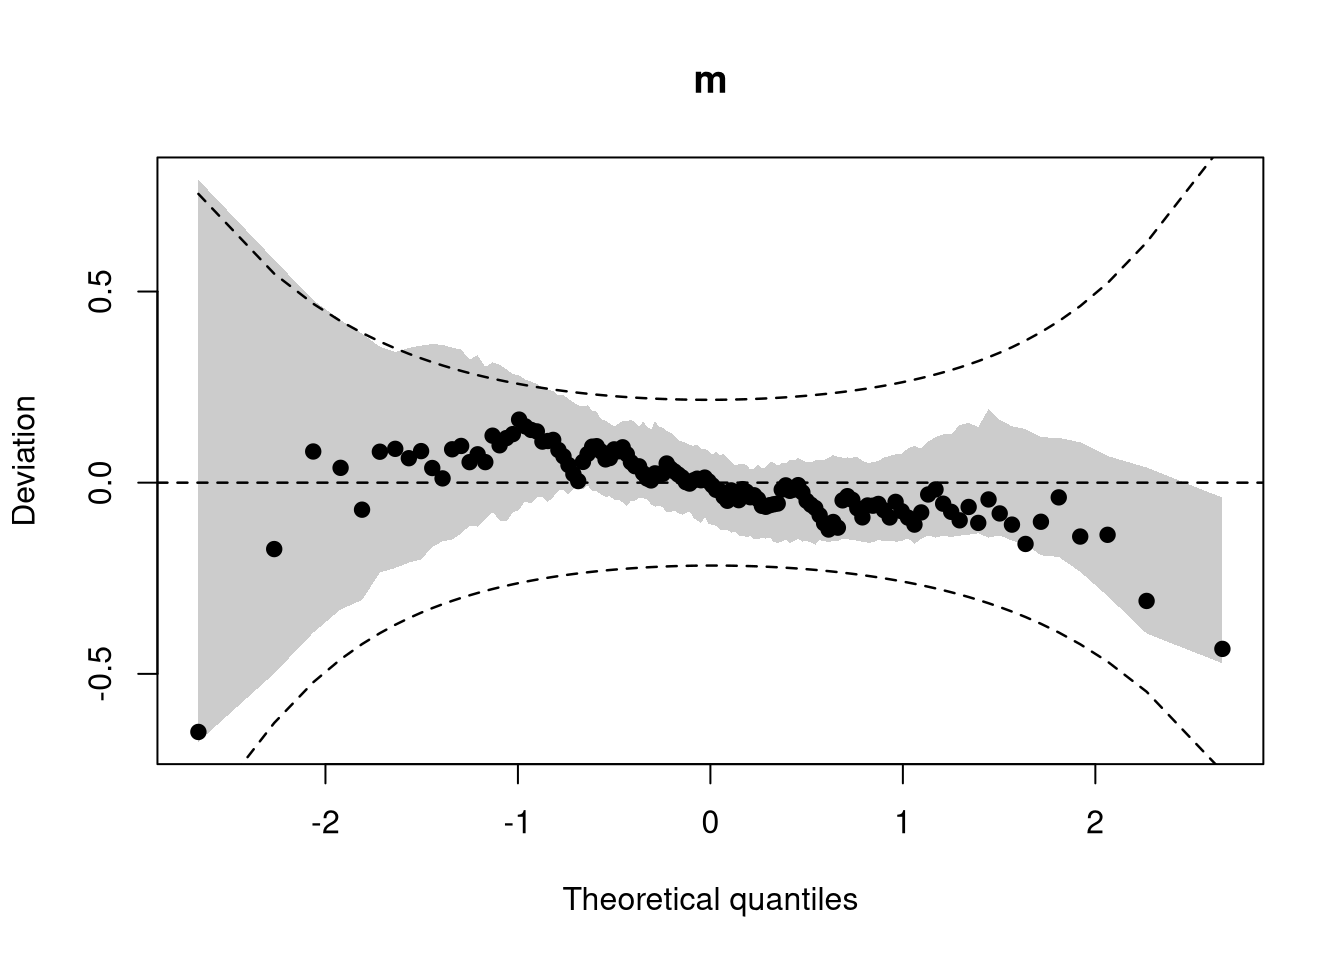
reliagram(m)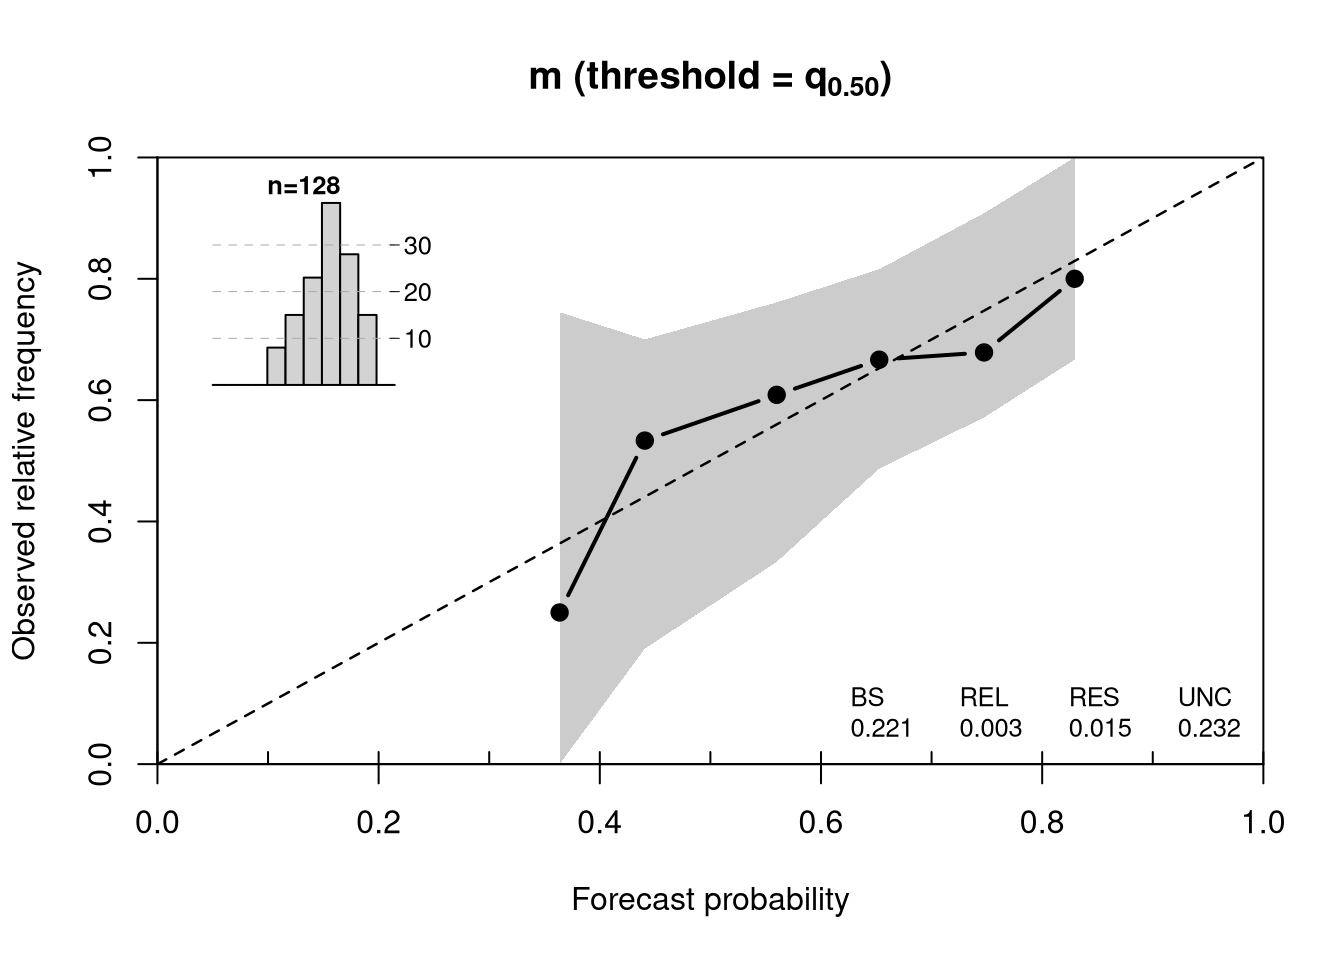
References
Buuren, Stef van, and Miranda Fredriks. 2001. “Worm Plot: A Simple Diagnostic Device for Modelling Growth Reference Curves.” Statistics in Medicine 20 (8): 1259–77. https://doi.org/10.1002/sim.746.
Cribari-Neto, Francisco, and Achim Zeileis. 2010. “Beta Regression in R.” Journal of Statistical Software 34 (2): 1–24. https://doi.org/10.18637/jss.v034.i02.
Dunn, Peter K., and Gordon K. Smyth. 1996. “Randomized Quantile Residuals.” Journal of Computational and Graphical Statistics 5 (3): 236–44. https://doi.org/10.2307/1390802.
Gneiting, Tilmann, Fadoua Balabdaoui, and Adrian E. Raftery. 2007. “Probabilistic Forecasts, Calibration and Sharpness.” Journal of the Royal Statistical Society: Series B (Methodological) 69 (2): 243–68. https://doi.org/10.1111/j.1467-9868.2007.00587.x.
Gneiting, Tilmann, and Adrian E. Raftery. 2007. “Strictly Proper Scoring Rules, Prediction, and Estimation.” Journal of the American Statistical Association 102 (477): 359–78. https://doi.org/10.1198/016214506000001437.
Kleiber, Christian, and Achim Zeileis. 2016. “Visualizing Count Data Regressions Using Rootograms.” The American Statistician 70 (3): 296–303. https://doi.org/10.1080/00031305.2016.1173590.
Messner, Jakob W., Georg J. Mayr, and Achim Zeileis. 2016. “Heteroscedastic Censored and Truncated Regression with crch.” The R Journal 8 (1): 173–81. https://doi.org/10.32614/RJ-2016-012.
Schlosser, Lisa, Torsten Hothorn, Reto Stauffer, and Achim Zeileis. 2019. “Distributional Regression Forests for Probabilistic Precipitation Forecasting in Complex Terrain.” The Annals of Applied Statistics 13 (3): 1564–89. https://doi.org/10.1214/19-AOAS1247.
Stasinopoulos, D Mikis, and Robert A Rigby. 2007. “Generalized Additive Models for Location Scale and Shape (GAMLSS) in R.” Journal of Statistical Software 23 (7): 1–46. https://doi.org/10.18637/jss.v023.i07.
Umlauf, Nikolaus, Nadja Klein, Thorsten Simon, and Achim Zeileis. 2021. “bamlss: A Lego Toolbox for Flexible Bayesian Regression (and Beyond).” Journal of Statistical Software 100 (4): 1–53. https://doi.org/10.18637/jss.v100.i04.
Umlauf, Nikolaus, Nadja Klein, and Achim Zeileis. 2018. “BAMLSS: Bayesian Additive Models for Location, Scale and Shape (and Beyond).” Journal of Computational and Graphical Statistics 27 (3): 612–27. https://doi.org/10.1080/10618600.2017.1407325.
Wickham, Hadley. 2016. ggplot2: Elegant Graphics for Data Analysis. Springer-Verlag. https://ggplot2.tidyverse.org/.
Wilks, Daniel. 2011. Statistical Methods in the Atmospheric Sciences. 3rd ed. Academic Press.
Zeileis, Achim, Christian Kleiber, and Simon Jackman. 2008. “Regression Models for Count Data in R.” Journal of Statistical Software 27 (8): 1–25. https://doi.org/10.18637/jss.v027.i08.